
Quarterly insights: Internet of Things
Wider opportunity for IoT companies seeking growth capital

For much of the history of the Internet of Things sector, whether IoT companies attracted growth capital depended in large part on whether their business model conformed to the market’s perceptions (or biases) about what “worked.”
Perceptions of what worked varied over the years and included vertical strategies like fleet solutions, home monitoring and smart home, and business models such as software-as-a-service. Perceptions of what worked had their opposites, such as the perception that hardware-centric IoT business models had poor prospects.
Based on our analysis of recent IoT public stock performance and many conversations with investors interested in the sector, it appears capital markets are now judging companies more on their own merits rather than on whether they fit a popular conception of what constitutes the best model, strategy or technology.
We think this is positive for the sector, creating a more level playing field for new and innovative solutions competing for capital.
TABLE OF CONTENTS
- The themes that historically swayed capital
- Our analysis of recent public markets IoT performance
- Our takeaway: The door of opportunity has opened wider
- IoT index up modestly over past year
- IoT M&A: Notable transactions include KORE and Particle Industries
- IoT private placements: Notable investments include Wiliot, CargoSense, and Cambridge Mobile Telematics
The themes that historically swayed capital
Since we began publishing research on the IoT sector in 2013, no single theme has defined the sector; rather various themes have come and gone. One example was fleet solutions for the trucking sector. This theme had multiple waves of subthemes, starting with fleet telematics, where companies such as publicly traded Fleetmatics (acquired by Verizon), publicly traded Samsara (IOT) and privately held Geotab attracted substantial capital that helped fuel their growth. The fleet telematics subtheme was succeeded by video telematics. Capital flowed to companies like Samsara (as it added video telematics to its fleet telematics) and to privately held companies like Lytx (acquired by GTCR in 2016 and again by Permira in 2020) and First Analysis portfolio company Smart Witness (acquired by Sensata Technologies in 2021).
Another theme was home monitoring and smart home, with successes like Alarm.com (ALRM), Vivint Smart Home (which went public and was acquired by NRG Energy in 2023), and Ring (acquired by Amazon in 2018).
Addressing a topical vertical theme did not guarantee success, and there were a good number of failures along the way; however, the capital markets were receptive to companies that did so and rewarded signs of success with ample capital for growth and rich valuations.
Business model was another theme that swayed capital flows, most prominently in the shift toward SaaS and other recurring revenue models. This shift was troubling for many quality IoT companies: Much of the IoT sector relies on specialized, proprietary hardware that requires substantial capital investment. The prospect of converting to a recurring revenue model (effectively renting rather than selling the hardware) was daunting without substantial outside capital. Further, investors liked the simplicity of software business models. Many private investors simply would not consider any business with hardware as part of its offering, and the public markets punished hardware companies with discounted valuations.
Of course, these themes were not the sole determiners of valuation. Public companies that fit the themes but could not demonstrate growth and missed revenue and earnings targets were still punished. Public companies that grew quickly and regularly beat revenue and earnings guidance were still rewarded with a rising share price; however, those that fit the themes of the day were better rewarded than similar beat-and-raise companies that did not.
Our analysis of recent public markets IoT performance
Today, the situation appears to have changed dramatically. We analyzed the performance of 19 public companies that we consider representative of a broad swath of the IoT universe. The results are shown in Tables 1-3, and we highlight some of the results in the subsector analysis below. We looked at the relationship between stock price performance for the 12 months through March 31 and several factors. These factors were primarily subsector grouping, 2025 revenue growth rates, and the degree to which companies exceeded or fell short of 2025 guidance. The time frame we used enabled us to consider fourth-quarter results reported during Q1 as well as the forward-year guidance typically provided with full-year results.
TABLE 1: Revenue and revenue growth 2022 to 2025 (sorted by 2025 growth, dollars in millions)
| Revenue | Growth | ||||||
|---|---|---|---|---|---|---|---|
| CY2022 | CY2023 | CY2024 | CY2025 | 2023 | 2024 | 2025 | |
| Samsara (IOT)1 | $653 | $937 | $1,249 | $1,619 | 43.7% | 33.3% | 29.6% |
| Cerence (CRNC)4 | 317 | 349 | 244 | 316 | 10.1% | (30.1%) | 29.5% |
| Semtech (SMTC)1 | 757 | 869 | 909 | 1,050 | 14.8% | 4.7% | 15.5% |
| Karooooo (KARO)2 | 196 | 213 | 246 | 282 | 8.6% | 15.3% | 14.8% |
| Verra Mobility (VRRM) | 742 | 817 | 879 | 979 | 10.2% | 7.6% | 11.4% |
| Tuya (TUYA) | 208 | 230 | 299 | 322 | 10.5% | 29.8% | 7.8% |
| Alarm.com (ALRM) | 843 | 882 | 940 | 1,011 | 4.6% | 6.6% | 7.6% |
| Ituran Location and Control (ITRN) | 293 | 320 | 336 | 359 | 9.2% | 5.1% | 6.8% |
| Digi International (DGII)4 | 413 | 442 | 422 | 449 | 6.9% | (4.5%) | 6.4% |
| Arlo Technologies (ARLO) | 490 | 491 | 511 | 529 | 0.2% | 4.0% | 3.6% |
| Napco Security (NSSC)3 | 161 | 177 | 187 | 192 | 10.2% | 5.1% | 2.9% |
| CEVA (CEVA) | 121 | 97 | 107 | 110 | (19.2%) | 9.8% | 2.5% |
| Impinj (PI) | 258 | 308 | 366 | 361 | 19.3% | 19.0% | (1.4%) |
| Trimble (TRMB) | 3,676 | 3,799 | 3,683 | 3,587 | 3.3% | (3.0%) | (2.6%) |
| SmartRent (SMRT) | 168 | 237 | 175 | 152 | 41.1% | (26.2%) | (12.9%) |
| Inseego (INSG) | 245 | 167 | 191 | 166 | (31.8%) | 14.3% | (13.1%) |
| Airgain (AIRG) | 76 | 56 | 61 | 52 | (26.2%) | 8.1% | (14.6%) |
| Lantronix (LTRX)3 | 132 | 138 | 156 | 117 | 4.9% | 13.0% | (25.0%) |
| Total | $9,748 | $10,530 | $10,961 | $11,653 | 8.0% | 4.1% | 6.3% |
| Average company growth | 6.7% | 6.2% | 3.8% | ||||
| Median company growth | 8.9% | 7.1% | 5.0% | ||||
| Total growth (ex-Trimble) | 8.0% | 4.1% | 6.4% | ||||
Source: Company data, Capital IQ, First Analysis.
Notes: (1) Revenue and growth rates are based on IOT and SMTC’s reported revenue for its fiscal year ended January of 2022, 2023, 2024, and 2025. (2) Revenue and growth rates are based on KARO’s reported revenue for its fiscal year ended February of 2022, 2023, 2024, and 2025. (3) Revenue and growth rates are based on NSSC and LTRX’s reported revenue of the four quarters through December (their fiscal Q2) in 2022, 2023, 2024, and 2025. (4) Revenue and growth rates are based on CRNC and DGII’s reported revenue of the four quarters through December (Their fiscal Q1) in 2022, 2023, 2024, and 2025. PowerFleet (AIOT) not included because two years of comparable revenue performance is not available.
TABLE 2: 2025 revenue and EPS initial guidance compared to actual results (sorted by revenue difference)*
| Year end | Revenue | EPS | |||||||
|---|---|---|---|---|---|---|---|---|---|
| Guidance | Reported | % Difference | Guidance | Reported | $ Difference | % Difference | |||
| PowerFleet (AIOT) | Mar | $300 | $363 | 21% | ($0.01) | $0.04 | $0.05 | NA | |
| Samsara (IOT) | Jan | 1,528 | 1,619 | 6% | 0.33 | 0.56 | 0.23 | 70% | |
| Verra Mobility (VRRM) | Dec | 930 | 979 | 5% | 1.33 | 1.32 | (0.01) | (0%) | |
| Trimble (TRMB) | Dec | 3,420 | 3,570 | 4% | 2.87 | 3.13 | 0.26 | 9% | |
| Cerence (CRNC)1 | Sep | 242 | 252 | 4% | 20.50 | 48.1 | 27.60 | 135% | |
| Impinj (PI) | Dec | 348 | 361 | 4% | 1.43 | 2.11 | 0.68 | 47% | |
| Alarm.com (ALRM) | Dec | 980 | 1,011 | 3% | 2.29 | 2.62 | 0.34 | 15% | |
| Semtech (SMTC) | Jan | 1,038 | 1,050 | 1% | 1.68 | 1.71 | 0.03 | 2% | |
| Digi International (DGII) | Sep | 426 | 430 | 1% | 1.97 | 2.10 | 0.13 | 7% | |
| Arlo Technologies (ARLO) | Dec | 525 | 529 | 1% | 0.61 | 0.70 | 0.09 | 15% | |
| Airgain (AIRG) | Dec | 60 | 61 | 1% | (0.07) | (0.03) | 0.04 | NA | |
| Karooooo (KARO) | Feb | 244 | 246 | 1% | 1.56 | 1.70 | 0.14 | 9% | |
| Ituran Location and Control (ITRN) | Dec | 359 | 359 | (0%) | 3.03 | 2.92 | (0.11) | (4%) | |
| CEVA (CEVA) | Dec | 115 | 110 | (5%) | 0.53 | 0.42 | (0.11) | (20%) | |
| SmartRent (SMRT) | Dec | 164 | 152 | (7%) | (0.06) | (0.10) | (0.04) | NA | |
| Tuya (TUYA) | Dec | 358 | 322 | (10%) | 0.13 | 0.13 | – | 0% | |
| Inseego (INSG) | Dec | 192 | 166 | (14%) | 0.55 | 0.34 | (0.21) | (39%) | |
| Napco Security (NSSC) | Jun | 211 | 182 | (14%) | 1.54 | 0.87 | (0.67) | (44%) | |
| Lantronix (LTRX) | Jun | 168 | 123 | (27%) | 0.47 | 0.14 | (0.33) | (70%) | |
| Average | (3.1%) | ||||||||
| Median | (2.6%) | ||||||||
Source: First Analysis, company reports, Capital IQ.
Notes: For SMTC, TRMB, and IOT we show fiscal 2026 figures. For all other companies, we show fiscal 2025 figures. For companies lacking initial revenue and/or EPS guidance, we show consensus estimates as of approximately two weeks after reported year-end results. EPS = earnings per share. (1) Non-GAAP earnings per share not reported. Adjusted EBITDA used as a proxy for earnings performance.
TABLE 3: IoT stock price and market cap analysis
| 03/31/2021 | 03/31/2023 | 03/31/2025 | 03/31/2026 | Change | ||||||||
|---|---|---|---|---|---|---|---|---|---|---|---|---|
| Mkt. cap | Price | Mkt. cap | Price | Mkt. cap | Price | Mkt. cap | Price | 5-YR | 3-YR | 1-YR | ||
| IoT companies (ranked by 2026 percentage price change) | ||||||||||||
| Semtech (SMTC) | $4,502 | $69.00 | $1,542 | $24.14 | $2,976 | $34.40 | $7,147 | $76.89 | 11.4% | 218.5% | 123.5% | |
| Lantronix (LTRX) | 132 | 4.57 | 158 | 4.34 | 97 | 2.49 | 208 | 5.24 | 14.7% | 20.7% | 110.4% | |
| Digi (DGII) | 631 | 18.99 | 1,204 | 33.68 | 1,027 | 27.83 | 1,813 | 48.20 | 153.8% | 43.1% | 73.2% | |
| Napco Security (NSSC) | 639 | 17.42 | 1,381 | 37.58 | 838 | 23.02 | 1,405 | 39.39 | 126.2% | 4.8% | 71.1% | |
| Airgain (AIRG) | 219 | 21.19 | 55 | 5.37 | 39 | 3.37 | 67 | 5.50 | (74.0%) | 2.4% | 63.2% | |
| Arlo (ARLO) | 506 | 6.28 | 543 | 6.06 | 1,011 | 9.87 | 1,521 | 14.23 | 126.6% | 134.8% | 44.2% | |
| Inseego (INSG) | 1,019 | 100.00 | 63 | 5.82 | 123 | 8.17 | 180 | 11.12 | (88.9%) | 90.9% | 36.1% | |
| Ituran Location (ITRN) | 442 | 21.23 | 441 | 21.78 | 719 | 36.16 | 975 | 49.01 | 130.9% | 125.0% | 35.5% | |
| SmartRent (SMRT) | 384 | 10.00 | 508 | 2.55 | 233 | 1.21 | 288 | 1.50 | (85.0%) | (41.2%) | 24.0% | |
| Karooooo (KARO) | NA | NA | 718 | 23.20 | 1,314 | 42.54 | 1,540 | 49.84 | NA | 114.8% | 17.2% | |
| Impinj (PI) | 1,331 | 56.87 | 3,545 | 135.52 | 2,588 | 90.70 | 3,105 | 102.70 | 80.6% | (24.2%) | 13.2% | |
| Trimble (TRMB) | 19,552 | 77.79 | 12,945 | 52.42 | 16,136 | 65.65 | 15,259 | 65.23 | (16.1%) | 24.4% | (0.6%) | |
| Samsara (IOT) | NA | NA | 10,424 | 19.72 | 21,822 | 38.33 | 18,403 | 31.69 | NA | 60.7% | (17.3%) | |
| Cerence (CRNC) | 3,378 | 89.58 | 1,130 | 28.09 | 341 | 7.90 | 284 | 6.31 | (93.0%) | (77.5%) | (20.1%) | |
| Alarm.com (ALRM) | 4,283 | 86.38 | 2,495 | 50.28 | 2,763 | 55.65 | 2,145 | 43.19 | (50.0%) | (14.1%) | (22.4%) | |
| Tuya (TUYA) | 11,833 | 21.14 | 1,041 | 1.89 | 1,803 | 3.03 | 1,416 | 2.31 | (89.1%) | 22.2% | (23.8%) | |
| CEVA (CEVA) | 1,281 | 56.15 | 713 | 30.43 | 612 | 25.61 | 518 | 18.68 | (66.7%) | (38.6%) | (27.1%) | |
| Verra Mobility (VRRM) | 2,196 | 13.54 | 2,534 | 16.92 | 3,592 | 22.51 | 2,163 | 14.29 | 5.6% | (15.5%) | (36.5%) | |
| PowerFleet (AIOT) | 292 | 8.22 | 122 | 3.43 | 727 | 5.49 | 411 | 3.08 | (62.5%) | (10.2%) | (43.9%) | |
| Total | $52,619 | $41,562 | $58,762 | $58,849 | ||||||||
| Median | 1.4% | 33.7% | 22.1% | |||||||||
| Average | (16.1%) | 20.7% | 17.2% | |||||||||
| Market capitalization weighted average | (31.7%) | 31.0% | (0.5%) | |||||||||
| Indexes | ||||||||||||
| Nasdaq Composite | 13,246.87 | 12,221.91 | 17,299.29 | 21,590.63 | 63.0% | 76.7% | 24.8% | |||||
| Russell 2000 | 2,220.52 | 1,802.48 | 2,011.91 | 2,496.37 | 12.4% | 38.5% | 24.1% | |||||
| S&P 500 | 3,972.89 | 4,109.31 | 5,611.85 | 6,528.52 | 64.3% | 58.9% | 16.3% | |||||
| Stocks with return above Nasdaq | 5 | 5 | 8 | |||||||||
| Stocks with positive return | 8 | 12 | 11 | |||||||||
| Total number of stocks in category | 17 | 19 | 19 | |||||||||
| Percent of stocks outperforming Nasdaq | 29% | 26% | 42% | |||||||||
Source: First Analysis, Capital IQ.
Irrespective of these traditional metrics, we expected to see a strong influence on IoT stock prices from broad technology trends. The end of Q1 was perhaps the height of what is commonly called the SaaS-pocalypse, suggesting software-oriented SaaS or SaaS-like IoT stocks would come under pressure. The year also saw a renewed appreciation for semiconductor companies and technology hardware in general (along with the continuation of Nvidia’s multi-year rise), suggesting hardware-oriented IoT stocks would see strength.
While we saw some influence from these trends, the effect was relatively weak. IoT companies with similar business models in the same subsector experienced widely different performance. Further, stock performance appeared to be strongly negatively correlated with traditional growth and profitability metrics.
Subsector grouping analysis
The fleet telematics subsector provides some clear examples: Samsara (IOT), Karooooo (KARO), Ituran Location and Control (ITRN) and PowerFleet (AIOT) all provide hardware in some form (usually bundled with the solution) as well as software. One-year share price performance varied by nearly 80 percentage points across the group. Ituran’s stock rose 35.5% despite reporting 2025 revenue growth slightly below its modest 7% original guidance. Samsara, which grew revenue by 30% in 2025, declined 17.3%. PowerFleet declined 43.9% despite beating revenue guidance. We note PowerFleet’s results and growth were dominated by the effect of a major acquisition. Karooooo rose 17% with relatively modest 15% 2025 revenue growth. The analysis shows that even in one of the most established IoT verticals, performance was highly variable and not simply explained by being in the right category, beating or missing estimates or growth rate.
TABLE 4: Vertical grouping analysis
| 1-year price change1 |
2025 revenue growth |
2025 revenue vs. guide |
2025 EPS vs. guide |
2026e revenue growth1 |
EV/2026e revenue1 |
|
|---|---|---|---|---|---|---|
| Same vertical (connected fleets), same classification, 80-point share price change spread (ITRN – AIOT) | ||||||
| Samsara (IOT) | (17.3%) | 29.6% | 5.9% | $0.23 | 21.7% | 10.79x |
| Karooooo (KARO) | 17.2% | 14.8% | 0.7% | 0.14 | 39.8% | 4.50x |
| Ituran Location and Control (ITRN) | 35.5% | 6.8% | (0.1%) | (0.11) | 9.3% | 2.15x |
| PowerFleet (AIOT)2 | (43.9%) | 47.9% | 20.8% | 0.05 | 21.4% | 1.51x |
| Total spread | 79.4% | |||||
Source: Capital IQ, First Analysis.
Notes: (1) As of March 31, 2026. EV = enterprise value. (2) AIOT revenue growth driven by its acquisition of Fleet Complete.
The security and smart home subsector showed a similar pattern. Napco Security Technologies (NSSC), Arlo Technologies (ARLO) and Alarm.com all benefit from hardware-enabled recurring revenue models and operate in markets that were once very much in favor. Napco’s share price rose 71.1%. Arlo appreciated 44.2%. Alarm.com declined 22.4% despite posting the best revenue growth of the three, beating revenue guidance by 3.2%, and beating EPS guidance by $0.34. In contrast, Napco missed its revenue guidance by 14.1% and EPS guidance by $0.67, but its stock still materially outperformed.
TABLE 5: End market grouping analysis
| 1-year price change1 |
2025 revenue growth |
2025 revenue vs. guide |
2025 EPS vs. guide |
2026e revenue growth1 |
EV/2026e revenue1 |
|
|---|---|---|---|---|---|---|
| Same end market (connected home and building security), 93-point share price change spread (NSSC – ALRM) | ||||||
| Napco Security Tech. (NSSC) | 71.1% | 2.9% | (14.1%) | $(0.67) | 8.9% | 6.50x |
| Alarm.com (ALRM) | (22.4%) | 7.6% | 3.2% | 0.34 | 5.0% | 2.15x |
| Arlo Technologies (ARLO) | 44.2% | 3.6% | 0.8% | 0.09 | 6.7% | 2.41x |
| Total spread | 93.5% | |||||
Source: Capital IQ, First Analysis.
Notes: (1) As of March 31, 2026. EV = enterprise value.
Revenue grouping analysis
Revenue growth rates also appeared to have little relationship to share price performance. Digi International (DIGI), Ituran, Alarm.com and Tuya (TUYA) all grew 2025 revenue at rates within a fairly tight band, roughly 6% to 8%. Further, their forward growth outlooks were broadly similar, with implied 2026 revenue growth ranging from 5.0% to 12.4%. Yet, their share price changes ranged from Digi appreciating 73.2% to Tuya declining 23.8%, with Ituran up 35.5% and Alarm.com down 22.4%.
TABLE 6: Revenue grouping analysis
| 1-year price change1 |
2025 revenue growth |
2025 revenue vs. guide |
2025 EPS vs. guide |
2026e revenue growth1 |
EV/2026e revenue1 |
|
|---|---|---|---|---|---|---|
| Similar revenue growth, opposite outcomes – 97-point share price change spread (DIGI – TUYA) | ||||||
| Digi International (DGII) | 73.2% | 6.4% | 0.9% | $0.13 | 12.4% | 3.70x |
| Ituran Location and Control (ITRN) | 35.5% | 6.8% | (0.1%) | (0.11) | 9.3% | 2.15x |
| Alarm.com Holdings (ALRM) | (22.4%) | 7.6% | 3.2% | 0.34 | 5.0% | 2.15x |
| Tuya (TUYA) | (23.8%) | 7.8% | (10.2%) | – | 11.0% | 1.31x |
| Total spread | 97.0% | |||||
Source: Capital IQ, First Analysis.
Notes: (1) As of March 31, 2026. EV = enterprise value.
Guidance grouping analysis
Perhaps the most counterintuitive cut was the relationship between share price performance and the degree to which companies exceeded or fell short of guidance. Several companies that missed guidance performed well, while several companies that beat guidance performed poorly. Lantronix (LTRX) missed materially on both revenue guidance (by 26.9%) and EPS guidance (by $0.33) but was still the second-best performing stock in the group, up 110.4%. Napco missed both revenue and EPS guidance and was up 71.1%. Alarm.com beat both top and bottom-line guidance handily, as noted above, and was down 22.4%.
TABLE 7: Guidance grouping analysis
| 1-year price change1 |
2025 revenue growth |
2025 revenue vs. guide |
2025 EPS vs. guide |
2026e revenue growth1 |
EV/2026e revenue1 |
|
|---|---|---|---|---|---|---|
| Share price performance inverted based on revenue/EPS beat vs. guidance | ||||||
| Alarm.com Holdings (ALRM) | (22.4%) | 7.6% | 3.2% | $0.34 | 5.0% | 2.15x |
| Lantronix (LTRX) | 110.4% | (25.0%) | (26.9%) | (0.33) | 2.8% | 1.69x |
| Napco Security Tech. (NSSC) | 71.1% | 2.9% | (14.1%) | (0.67) | 8.9% | 6.50x |
| Total spread | 138.0% | |||||
Source: Capital IQ, First Analysis.
Notes: (1) As of March 31, 2026. EV = enterprise value.
Our takeaway: The door of opportunity has opened wider
Our takeaway from this analysis is that we believe the capital markets are now as wide open for IoT as they have been in at least two decades. This has been corroborated in many conversations we’ve had recently with investors interested in the IoT space. Today, no single theme or business model is either a strong magnet or deterrent for capital.
This is not to imply the market is ignoring fundamentals. Visibility into future revenue and earnings is always positive, and companies still need to show they can grow, earn attractive margins, and forecast with credibility. But it appears capital markets are judging companies on their own merits rather than on whether they fit the preferred theme of the moment. In particular, businesses with upfront hardware sales, considered off limits to many investors even a year ago, appear to be welcomed by a wider audience.
With this backdrop, companies can pursue business models based on customer preferences and efficient capital allocation rather than based on capital market preconceptions about what works and doesn’t work. We view this as positive for the industry, as it enlarges the opportunity for new and innovative solutions to compete successfully for capital.
IoT index up modestly over past year
The First Analysis Internet of Things Index gained 4.3% over the one-year period ended June 15, well short of the S&P 500’s 25.2% gain and the Nasdaq’s 35.4% gain over the same period. The index performed well through the first half of the period, reaching a peak gain of 18.2%, before declining early in 2026 and recovering partially in the last few months.
Of the 19 IoT companies in the index, 12 saw their stock prices appreciate during the year, and 11 appreciated by more than 10%. Semtech (SMTC) was the top performer, gaining 345%, followed by Lantronix (LTRX), which gained 190%, CEVA (CEVA), which gained 144%, and Digi International (DGII), which gained 109%. The largest decline was at Verra Mobility (VRRM), which fell 79%, followed by Trimble (TRMB), which declined 29%, Arlo Technologies (ARLO), which declined 23%, Tuya (TUYA), which declined 20%, and Alarm.com (ALRM), which declined 20%. The index’s modest gain despite broad positive performance across constituents reflects market-cap weighting, as declines at larger constituents such as Trimble and Samsara offset gains across several smaller companies.
Internet of Things public comparables* ($ in millions)
| LTM rev. |
Rev. growth 2025A‑2026E |
Rev. growth 2026E‑2027E |
LTM gross margin |
LTM EBITDA margin |
EV/rev. 2026E |
EV/rev. 2027E |
EV/EBITDA 2026E1 |
EV/EBITDA 2027E1 |
|
|---|---|---|---|---|---|---|---|---|---|
| Airgain (AIRG) | $51.3 | 9.6% | 17.6% | 43.6% | (8.0%) | 1.49x | 1.27x | NMF | 15.2x |
| Alarm.com (ALRM) | 1,037.6 | 5.4% | 4.7% | 65.8% | 15.4% | 2.22x | 2.12x | 11.0x | 10.1x |
| Arlo Technologies (ARLO) | 560.6 | 6.9% | 8.7% | 45.1% | 3.8% | 2.25x | 2.07x | 13.6x | 11.1x |
| Cerence (CRNC) | 302.1 | (13.5%) | 11.8% | 78.3% | 13.3% | 2.09x | 1.87x | 14.9x | 6.6x |
| CEVA (CEVA) | 112.4 | 11.9% | 13.7% | 87.2% | (6.9%) | 9.39x | 8.26x | NMF | 41.8x |
| Digi International (DGII) | 475.1 | 19.0% | 6.8% | 64.5% | 21.8% | 5.10x | 4.77x | 19.6x | 17.5x |
| Impinj (PI) | 361.0 | 3.4% | 23.4% | 52.5% | 2.5% | 11.50x | 9.32x | NMF | 38.3x |
| Inseego (INSG) | 168.9 | 13.5% | 14.4% | 43.0% | 2.0% | 1.17x | 1.02x | 12.3x | 9.1x |
| Ituran Location and Control (ITRN) | 375.2 | 14.0% | 6.5% | 49.6% | 26.5% | 2.98x | 2.80x | 11.3x | 10.5x |
| Karooooo (KARO) | 338.0 | 18.2% | 17.7% | 68.0% | 39.0% | 3.97x | 3.37x | 9.8x | 8.5x |
| Lantronix (LTRX) | 118.6 | 8.4% | 16.0% | 43.0% | (1.4%) | 2.08x | 1.79x | 32.5x | 24.7x |
| Napco Security Tech. (NSSC) | 197.2 | 8.1% | NA | 57.3% | 29.5% | 5.89x | NA | 18.5x | NA |
| PowerFleet (PWFL) | 443.8 | 9.3% | 11.4% | 55.5% | 19.3% | 1.72x | 1.54x | 7.1x | 5.4x |
| Samsara (IOT) | 1,730.6 | 24.1% | 19.7% | 76.3% | (0.1%) | 9.13x | 7.62x | 41.9x | 33.6x |
| Semtech (SMTC) | 1,089.9 | 30.1% | 24.6% | 52.4% | 13.9% | 12.14x | 9.75x | NMF | 37.7x |
| SmartRent (SMRT) | 149.7 | 6.0% | 24.2% | 34.3% | (15.5%) | 0.77x | 0.62x | NMF | 15.0x |
| Trimble (TRMB) | 3,686.6 | 8.5% | 8.2% | 71.5% | 23.5% | 3.31x | 3.06x | 11.2x | 10.2x |
| Tuya (TUYA) | 328.0 | 11.0% | 11.7% | 47.8% | 6.6% | 0.78x | 0.70x | 7.2x | 5.9x |
| Verra Mobility (VRRM) | 979.4 | 1.0% | (4.2%) | 56.9% | 36.6% | 1.82x | 1.90x | 4.7x | 5.4x |
| Average | $658.2 | 10.2% | 12.5% | 57.5% | 11.7% | 4.20x | 3.55x | 15.4x | 17.0x |
| Median | $361.0 | 9.3% | 11.8% | 55.5% | 13.3% | 2.25x | 2.09x | 11.8x | 10.8x |
Source: Capital IQ, First Analysis.
Notes: Public comparable company data shown above is as of June 15, 2026.
(1) EBITDA multiples less than 0 and greater than 50 labeled “not meaningful” (NMF). LTM = last 12 months. EBITDA = earnings before interest, taxes, depreciation and amortization.
Valuation multiples were relatively stable over the period. The IoT index’s enterprise value multiple of trailing-12-month revenue as of June 15 was 5.4, down slightly from 5.6 at the beginning of the period and below the Nasdaq’s 6.0 ending multiple, but above the S&P 500’s 4.0 ending multiple. Looking at forward multiples, the average enterprise value multiple of estimated revenue was 4.2 for 2026 and 3.6 for 2027. Semtech (SMTC) traded at the highest multiples for estimated 2026 revenue (12.1) and estimated 2027 revenue (9.8), followed by Impinj (PI), with an 11.5 multiple for 2026 and 9.3 for 2027. Revenue is projected to grow 10.2% on average in 2026 and 12.5% in 2027.
The current IoT index includes 19 public companies across connectivity, telematics, smart building, security, semiconductor and device-management use cases.
First Analysis Internet of Things Index 1-year performance
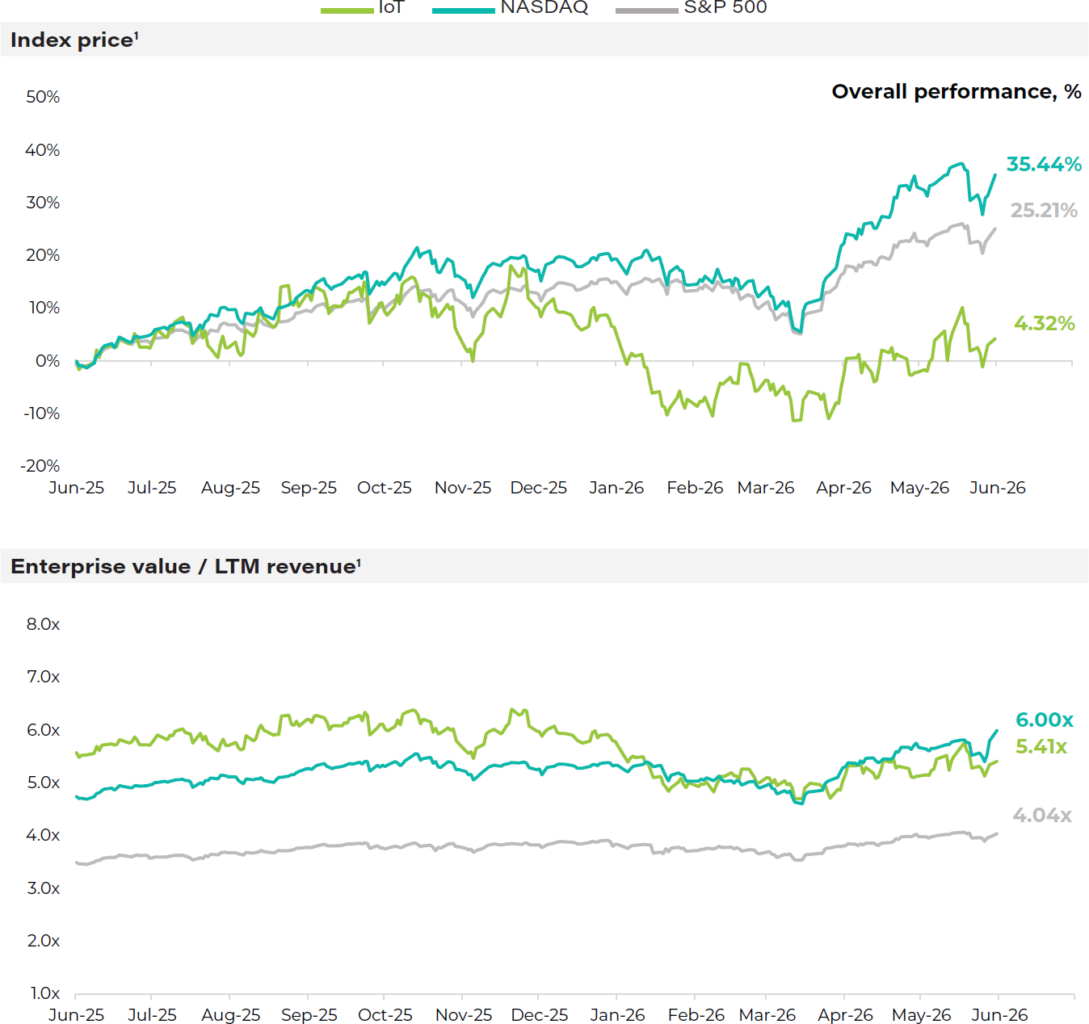
Source: Capital IQ.
Notes: (1) Index performance is weighted by market cap. For the period from June 15, 2025, through June 15, 2026.
IoT M&A: Notable transactions include KORE and Particle Industries
We highlight two IoT acquisitions in the year to date.
In February, KORE (KORE) announced it entered into a definitive agreement in which Searchlight Capital Partners and Abry Partners acquired the balance of KORE interests they did not already own in an all-cash transaction valued at approximately $726 million, or about 2.4 times estimated 2026 revenue. KORE, a public pure-play IoT connectivity company, provides IoT connectivity, solutions and analytics for enterprise customers. The transaction gives KORE private equity sponsorship and takes the company out of the public markets, where its scale, capital structure and long-term IoT connectivity strategy likely made it harder to execute. The transaction was expected to close in the second or third quarter.
KORE provides a single dashboard to manage IoT connectivity across carriers
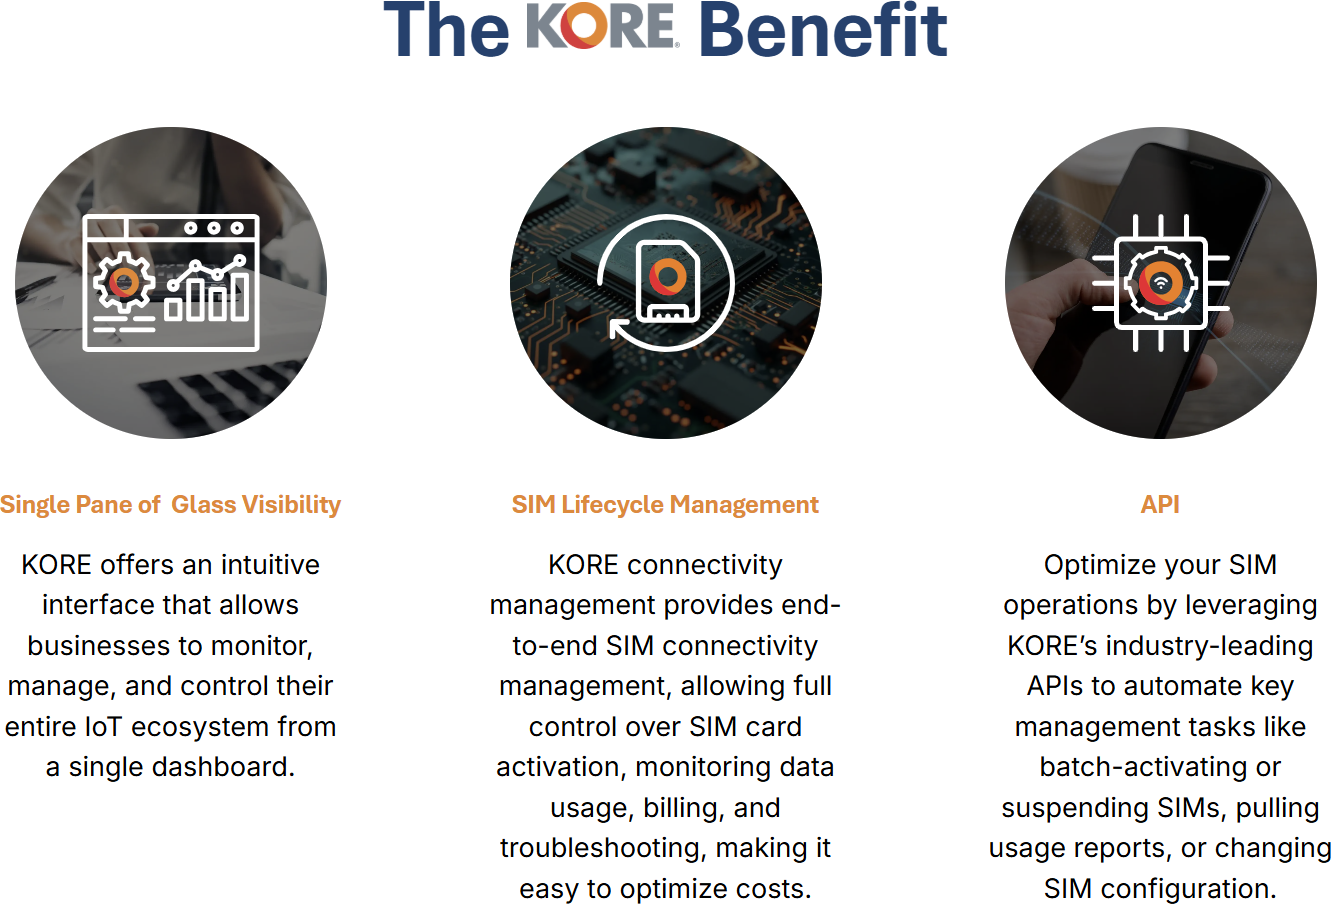
Source: KORE.
In January, Digi International (DGII) acquired Particle Industries for $50 million in cash. Particle provides software and infrastructure that help companies build, connect and manage intelligent devices across networks, from edge devices to the cloud. The platform lets developers send device data across multiple networks, including cellular connectivity that automatically selects the best carrier across more than 350 global cellular networks. It has been used by more than 250,000 developers since launch. Particle generates approximately $20 million of annually recurring revenue (ARR), which is growing at a double-digit percentage pace. The transaction value implies a purchase multiple approximately 2.5 times ARR. Digi said the acquisition increases ARR in its IoT products and services segment by more than 60%, while also adding cross-sell opportunities through Digi’s global sales team and channel relationships. As Digi is adding a higher-growth software layer to its existing hardware and connectivity business, customers will be able to “ship software to hardware at scale.” The addition also strengthens Digi’s position in edge AI, edge compute and cellular IoT.
Particle Connectivity connects devices, cloud platforms and applications across global IoT networks
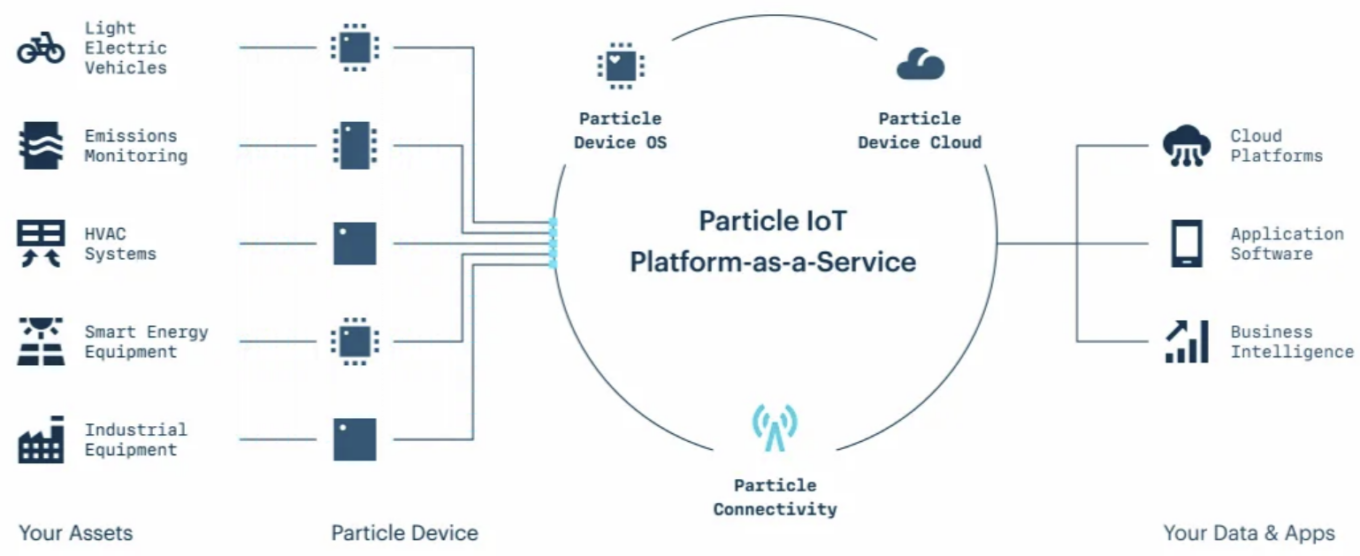
Source: Particle Connectivity.
Select recent M&A transactions (sorted by date of announcement, $ in millions)
| Date | Target | Target business description | Buyer | Enterprise value |
Enterprise value/rev. |
|---|---|---|---|---|---|
| 6/9/2026 | Greenwave Systems | Connected-device management software enabling telecom operators to orchestrate broadband, Wi-Fi, smart home and IoT services | AXON Networks | Undisclosed | Undisclosed |
| 6/4/2026 | Brickhouse GPS | GPS fleet telematics and asset tracking platform enabling real-time visibility, safety and operational efficiency | Grady Bay Capital | Undisclosed | Undisclosed |
| 4/23/2026 | Idelic | Fleet safety platform analyzing telematics data to predict driver risk and optimize safety interventions | Descartes Systems (DSG) | $28.0 | Undisclosed |
| 4/8/2026 | Blackline Safety (BLN) | Connected worker safety platform offering gas detection wearables, lone-worker monitoring, and real-time emergency response software | Francisco Partners | $589.4 | 5.38x |
| 3/2/2026 | vMOX | Enterprise mobility management for IoT device procurement, life cycle and carrier cost optimization | Wireless Mobility | Undisclosed | Undisclosed |
| 2/27/2026 | KORE | Pure-play global IoT connectivity platform; manages devices, connectivity and managed services for enterprises worldwide | Abry Partners; Searchlight Capital | $726.0 | 2.40x |
| 2/24/2026 | Origin Wireless | AI-powered ambient sensing turning existing Wi-Fi hardware into smart home motion and presence detectors | ADT (ADT) | $170.0 | Undisclosed |
| 2/19/2026 | Losant | Full-stack open industrial IoT platform for process automation and edge computing | SUSE | Undisclosed | Undisclosed |
| 1/29/2026 | AssetLink | Rugged asset tracking and intelligence solutions for industrial equipment, trailers and remote assets globally | Geoforce | Undisclosed | Undisclosed |
| 1/27/2026 | Particle Industries | Software and infrastructure that help companies build, connect and manage intelligent devices across networks, from edge devices to the cloud | Digi (DGII) | $50.0 | Undisclosed |
Source: Capital IQ, First Analysis.
IoT private placements: Notable investments include Wiliot, CargoSense, and Cambridge Mobile Telematics
We highlight three noteworthy IoT private placements in the year to date. The transactions reflect continued interest in tracking information about assets beyond simple location, including item-level condition sensing and supply chain execution. Also, telematics remains topical despite being one of the more mature areas of the IoT ecosystem.
In April, Avery Dennison (AVY) announced a $75 million minority investment in Wiliot, a supply chain physical AI company. Wiliot uses battery-free Bluetooth sensors and cloud-based AI to provide continuous visibility into item location and condition. The investment deepens Avery Dennison’s relationship with Wiliot and pairs Wiliot’s sensing technology with Avery Dennison’s global manufacturing and commercial scale. As Wiliot’s co-founder and CEO stated, “Avery Dennison is a global leader in digital identification solutions and the premier partner in the design, manufacturing and go-to-market capabilities for Wiliot at the scale required to realize accelerating demand.” Strategically, the investment expands Avery Dennison’s digital identification business beyond radio frequency identification into low-cost sensing, helping customers track not just where products are, but also their condition as they move through retail, logistics and food supply chains.
Wiliot IoT Pixels capture item-level location, movement and condition data

Source: Wiliot
Also in April, CargoSense announced a strategic investment from MegaChips and a partnership aimed at next-generation supply chain execution and automation. CargoSense provides a supply chain execution and exception management platform that integrates fragmented data in real time and turns it into actionable intelligence before issues arise. MegaChips is a Japan-based fabless semiconductor company. MegaChips plans to use CargoSense’s platform to enter markets with strict real-time supply chain requirements, including data center construction and pharmaceutical sectors. The investment reinforces the theme that IoT supply chain applications are moving beyond visibility toward automated exception management and condition-based decision support.
CargoSense digital agents automate shipment monitoring and exception detection
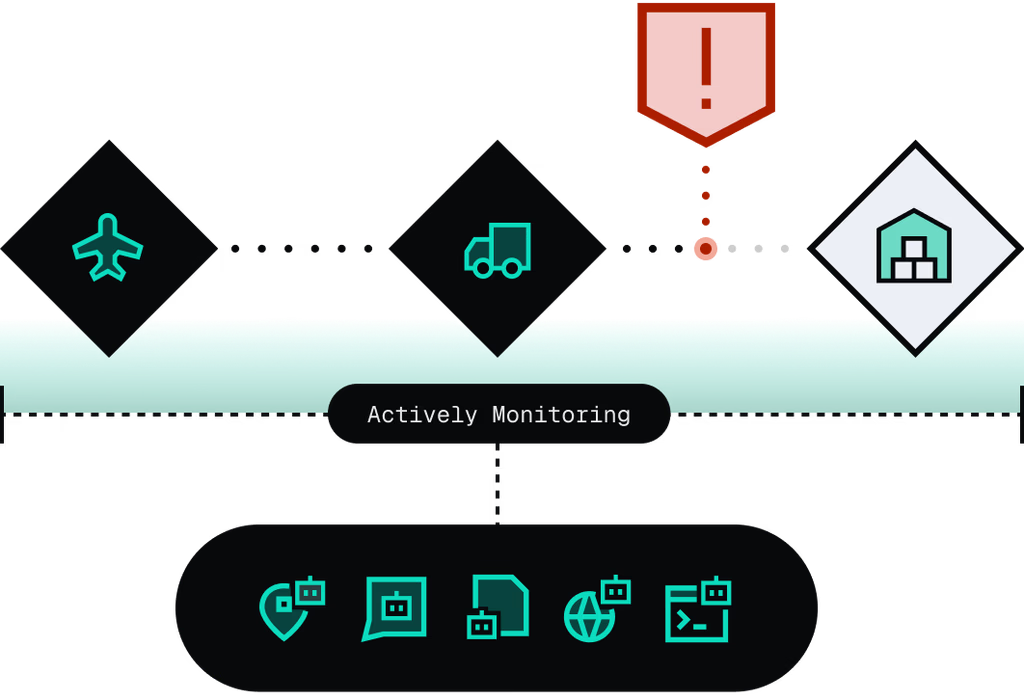
Source: CargoSense.
In March, Cambridge Mobile Telematics (CMT) announced a $350 million strategic investment led by TPG and Allianz X, with participation from State Farm. CMT provides telematics and AI technology for safer mobility, using driving data and real-time risk models to help insurers and mobility companies assess risk, detect crashes and encourage safer driving. The investment is accompanied by long-term commercial agreements with Allianz entities and is intended to accelerate CMT’s global road safety platform, real-time AI risk assessment, crash detection and Universal Driving Score.
CMT DriveWell turns trip data into driving risk scores and driver feedback

Source: Cambridge Mobile Telematics.
Select recent private placements (sorted by date of announcement, $ in millions)
| Date | Company | Business description | Investors | Raise type | Amount raised |
Total amount raised |
|---|---|---|---|---|---|---|
| 5/20/2026 | Novity | Predictive maintenance software company helping process industries detect equipment failures and reduce unplanned downtime | Acario Innovation | Venture | Undisclosed | Undisclosed |
| 5/6/2026 | Power Factors | Renewable energy management software helping asset owners monitor performance, optimize operations and reduce downtime costs | Mubadala; Vista Equity Partners | Growth | Undisclosed | Undisclosed |
| 4/27/2026 | Wiliot | Item-level sensing technology company enabling product tracking, temperature monitoring and supply chain visibility | Avery Dennison (AVY) | Growth | $75.0 | $364.0 |
| 4/14/2026 | CargoSense | IoT-enabled supply chain platform providing real-time sensor-based shipment visibility and analytics | MegaChips | Growth | Undisclosed | Undisclosed |
| 3/25/2026 | Halter | Smart livestock collar company enabling virtual fencing, grazing management and 24/7 animal monitoring | Founders Fund | Series E | $220.0 | $423.0 |
| 3/25/2026 | Sift | AI intelligence layer that monitors and diagnoses complex industrial machines in real time; mission-critical IoT analytics | StepStone; GV; Riot Ventures | Series B | $42.0 | $67.0 |
| 3/24/2026 | Cambridge Mobile Telematics | AI-driven telematics and connected vehicle safety platform serving insurers, fleets and automakers | TPG | Growth | $350.0 | $502.5 |
| 3/18/2026 | Engage Mobilize | Captures field-level operational data via IoT integrations, geofencing and mobile connected devices | Free Radical Ventures | Series C | $9.4 | $31.2 |
| 3/4/2026 | Verdigris Technologies | Sensor network capturing real-time facility energy data for analytics and optimization | Southwire | Growth | Undisclosed | Undisclosed |
| 3/3/2026 | Latent AI | Optimizes and deploys AI inference models directly onto resource-constrained IoT edge devices | AUM Ventures | Growth | Undisclosed | Undisclosed |
| 1/30/2026 | Elevat | Platform aggregating real-time sensor data from industrial machinery for life cycle management | Undisclosed | Series A | $12.0 | $34.6 |
| 1/21/2026 | Autonomy Logic | Cloud-orchestrated virtual programmable logic controller platform connecting and controlling industrial IoT automation assets | Momenta Ventures | Seed | Undisclosed | Undisclosed |
| 1/20/2026 | Balena | End-to-end platform for building, deploying, and managing IoT device fleets at scale | LoneTree Capital | Growth | Undisclosed | Undisclosed |
Source: Capital IQ, First Analysis.
Request full report
To access the full report, please provide your contact information in the form below. Thank you for your interest in First Analysis research.