
Quarterly insights: Software as a Service
Recovery in SaaS valuations accelerated in Q3

The average SaaS company enterprise value multiple of 2026 estimated revenue was 6.0 at the end of the September quarter, up from 4.7 last quarter. For 2027 estimated revenue, the average multiple was 5.1, up from 4.0. We still do not see significant negative impacts from AI in analyst estimates for revenue growth rates.
Our SaaS universe stocks increased 23.8% on average in the September quarter, well above the 2.0% gain for the S&P 500. Year-to-date, however, our SaaS universe was up 3.6% on average, trailing the S&P 500’s 11.8% gain, and the median SaaS stock was down 10.6% year-to-date.
For the quarter, the leading SaaS groups were go-to-market (up 40.4%), cybersecurity (up 39.1%), and future of work (up 38.3%).
The correlations between enterprise value multiples of estimated revenue and revenue growth for 2026 and 2027 remained low.
TABLE OF CONTENTS
- Overview of our analysis
- Correlation of valuations to growth remains low as recovery localized
- One more M&A transaction in the quarter
- SaaS stocks gain 10X the S&P 500
- SaaS M&A: Notable transactions include ArisGlobal and Accelerant
- SaaS private placements: Notable transactions include Chai Discovery and Factory
Overview of our analysis
The average SaaS company enterprise value multiple of 2026 estimated revenue was 6.0 at the end of the September quarter, up from 4.7 last quarter. For 2027 estimated revenue, the average multiple was 5.1, up from 4.0. Revenue growth on average is expected to be 14.7% in 2026 (up from 14.3% last quarter) and 13.3% in 2027 (up from 12.4% last quarter). These estimates tend to be conservative by 2 to 5 percentage points when first issued (the 2026 estimate has already increased 1.4 percentage points).
Our SaaS universe stocks continued their recovery in the September quarter, gaining 23.8% on average, significantly outperforming the S&P 500’s 2.0% increase. Thirty-eight of the 93 stocks in our SaaS universe gained more than 30% in the quarter, but 21 stocks declined. The go-to-market group led for the quarter, gaining 40.4% on average, helped by the 81.0% gain in Amplitude (AMPL), which announced strong earnings and guidance and a new AI offering. The Internet of Things group lost 5.9% on average, due primarily to the 30.8% decline in Cerence (CRNC) and the 25.8% dip in Powerfleet (AIOT), both due to disappointment with results and guidance.
The go-to-market and future of work groups bounced back from losses last quarter. The cybersecurity group continued its strong gains as a perceived winner as AI agents proliferate; this sector was up 53.6% on average year-to-date, well ahead of the market despite dropping 25.7% in the March quarter’s indiscriminate meltdown.
We removed three companies from our SaaS universe: LiveRamp and Simulations Plus due to their acquisitions announced in the June quarter and Domo, whose acquisition was announced and closed in the September quarter.
Correlation of valuations to growth remains low as recovery localized
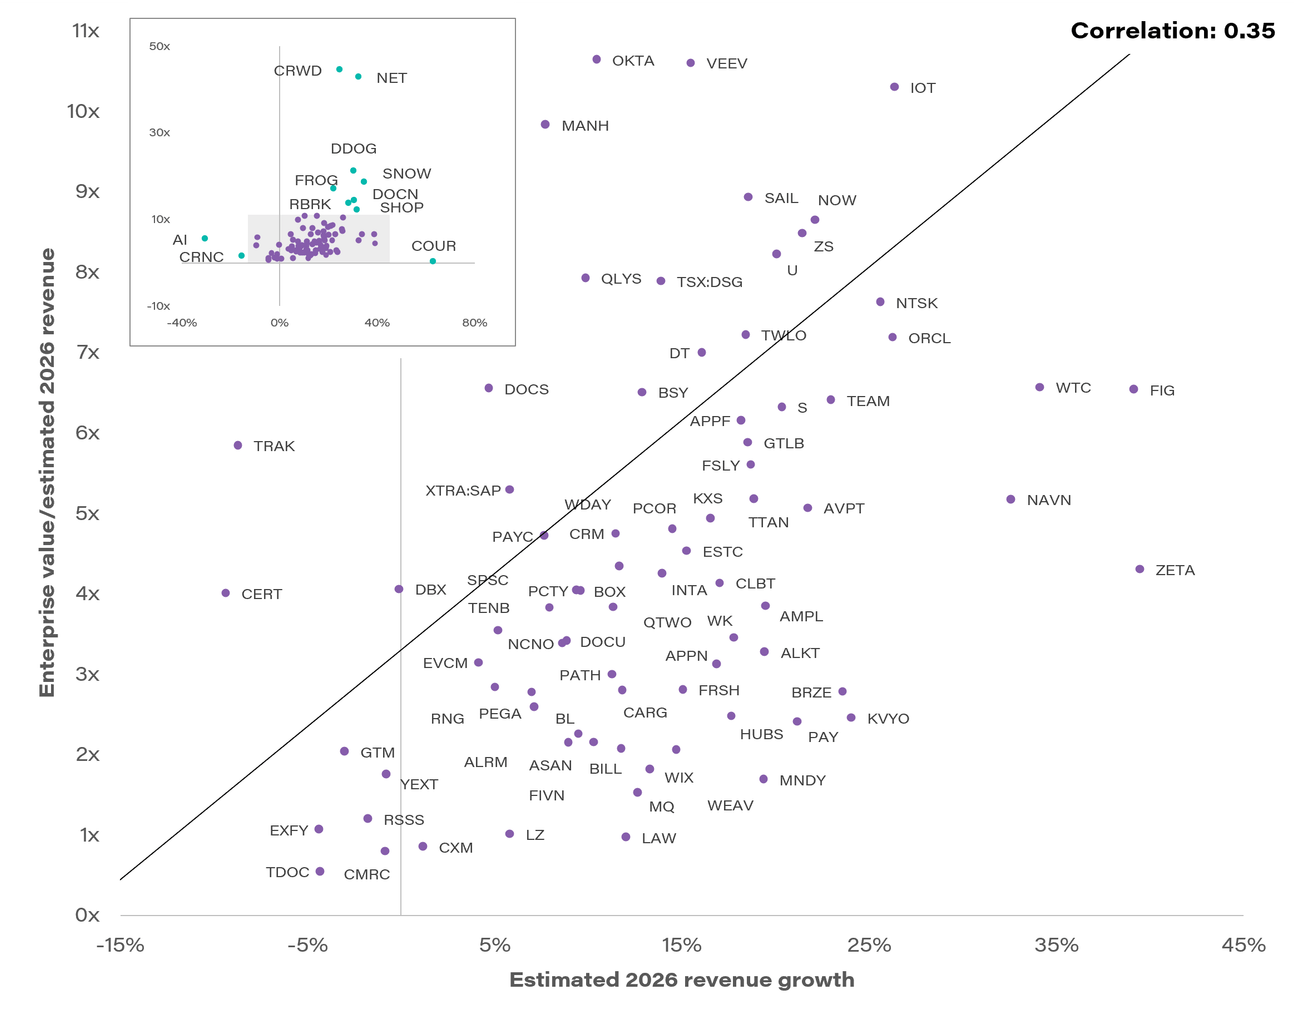
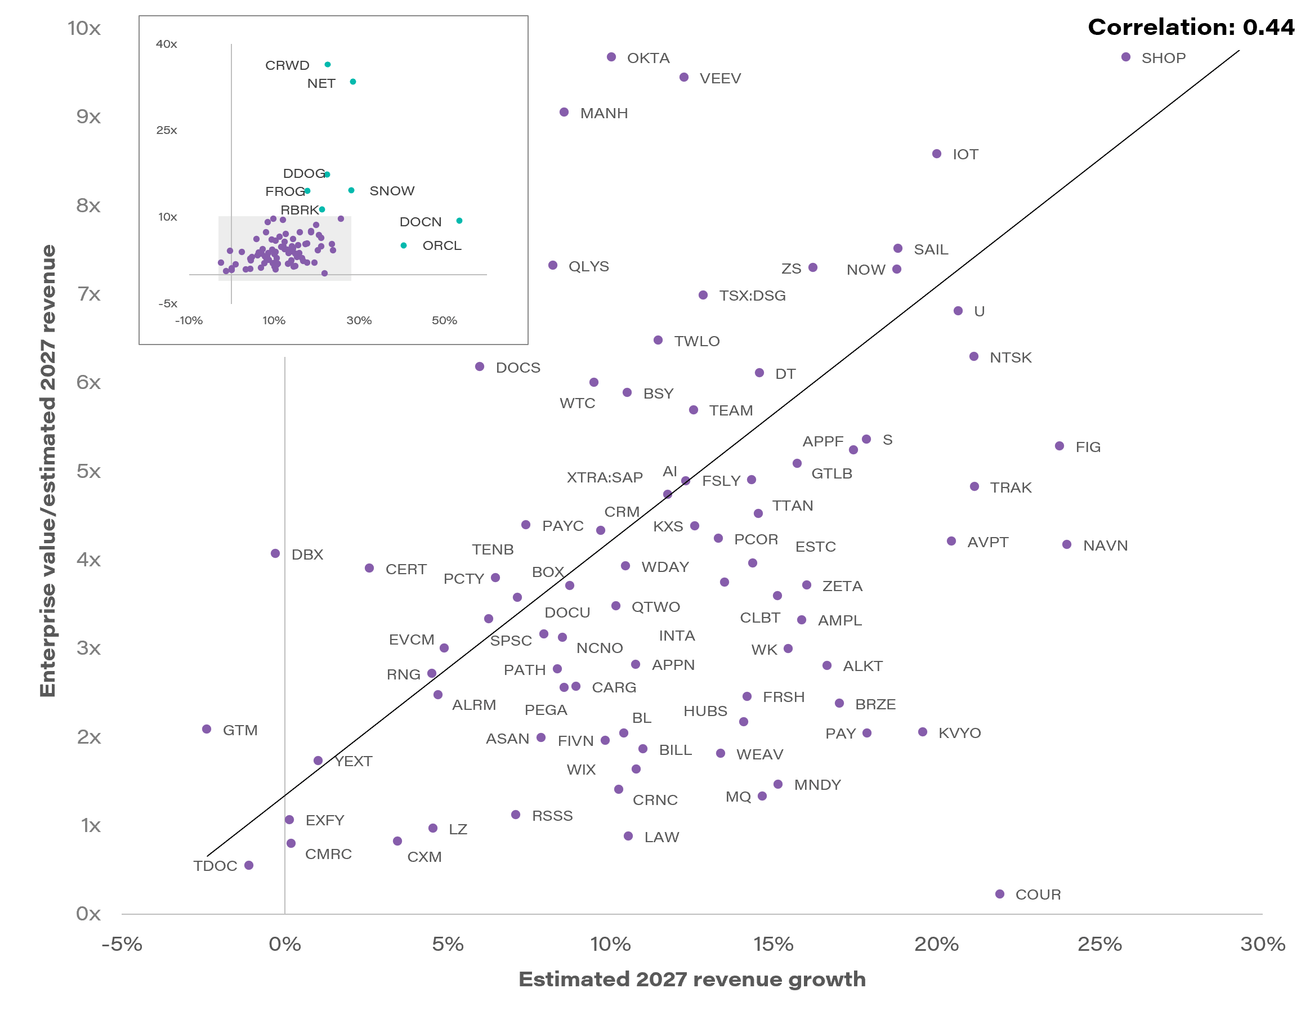
The correlations between enterprise value multiples of estimated revenue and estimated revenue growth remained low (shown in Tables 1 and 2) as more stocks recovered. The correlation for 2026 remained at 0.35, excluding Block (XYZ), MongoDB (MDB), PowerFleet and Roblox (RBLX). For 2027, the correlation was 0.44, down from 0.46.
TABLE 1: Enterprise value/revenue versus estimated revenue growth 2026
Main chart shows companies within (15%)–45% growth and 0–11x multiple in purple; inset shows the full universe with outliers in teal.
Source: First Analysis, Capital IQ; as of Sept. 30, 2026.
Notes: Excludes AIOT, MDB, RBLX and XYZ.
Stock price strength of eight of the largest SaaS companies, including Crowdstrike (CRWD), Oracle (ORCL), Salesforce (CRM), SAP (SAP), ServiceNow (NOW), Shopify (SHOP), Snowflake (SNOW) and Workday (WDAY) broadened, with almost all the stocks, except Oracle, up at least 30% (Shopify was up 29.9%). Oracle was down due to issues related to data center investment and financing. We believe the strategic interest in Workday may have helped spark interest in the rest of the large capitalization companies.
TABLE 2: Enterprise value/revenue versus estimated revenue growth 2027
Main chart shows companies within (5%)–30% growth and 0–10x multiple in purple; inset shows the full universe with outliers in teal.
Source: First Analysis, Capital IQ; as of Sept. 30, 2026.
Notes: Excludes AIOT, MDB, RBLX and XYZ.
Two other companies emerged as winners and were valued higher than Workday. Cloudflare (NET) reached an enterprise value over $100 billion, and Datadog (DDOG) was getting close to that level. Both appear to be benefitting from their AI-related offerings in security and data. We believe companies with deep domain expertise, suites of integrated functionality, and mission-critical (and money-moving) applications will likely bring AI to their customers, not AI generalist companies.
Over time, we expect the correlations between revenue growth and valuation multiples to recover, although what matters most is growth over the long term (which we define as the “growth curve”), beyond the horizon of 2026 and 2027 estimates.
One more M&A transaction in the quarter
In July, Domo announced a transaction to be acquired, which closed in September. Progress Software agreed to pay $400 million for most of the assets of Domo. Domo had negative cash flow and significant debt. The net price represented only 0.78 times 2027 estimated revenue (January fiscal year). Domo kept a $900 million loss carryforward and the net cash and changed its name to Huckleberry (HUCK).
In August, Reuters reported private equity firm Silver Lake was in talks to acquire Workday. With Workday valued at approximately $46 billion, or 4.3 times 2026 estimated revenue at the end of the quarter, it is among the top 10 market capitalization companies in our universe. Presumably, an acquisition would be at an even higher price.
Normally, we expect 5% to 10% of our SaaS universe to be acquired each year. With four transactions so far, we seem to be on track to meet the low end of that range in 2026. With average enterprise value multiples of revenue back in the 5 to 6 range, we think more companies may be willing to transact.
SaaS stocks gain 10X the S&P 500
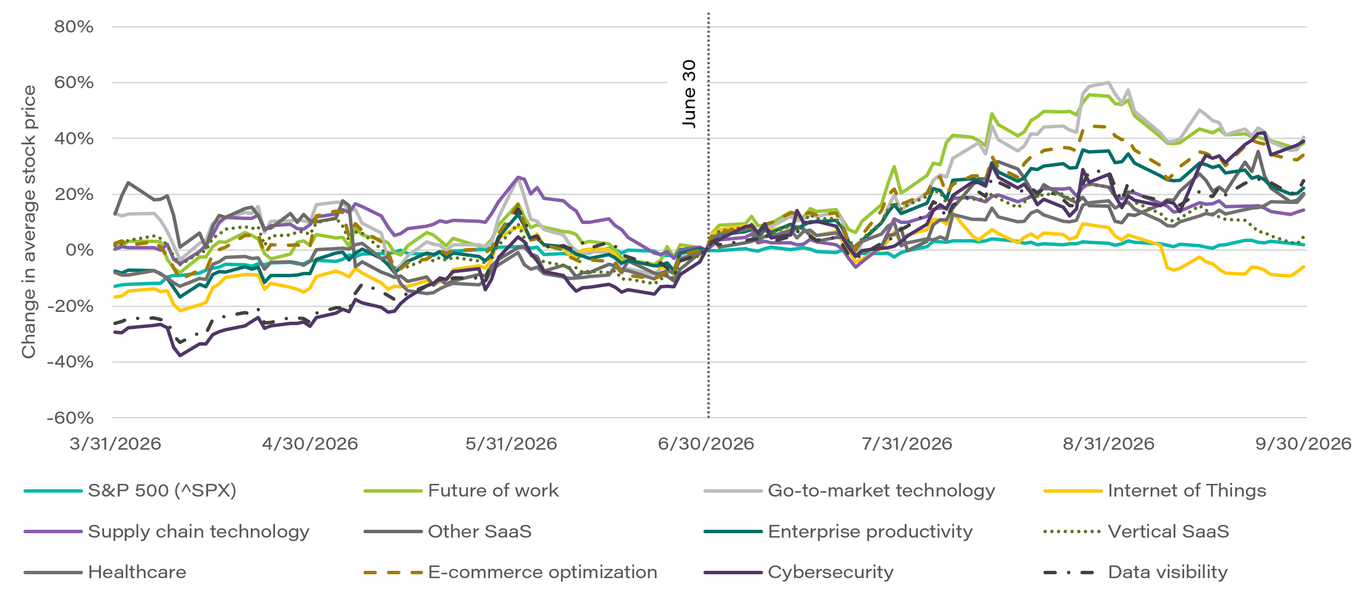
The average stock in our SaaS universe appreciated 23.8% in the September quarter, well above the 2.0% gain for the S&P 500. However, our SaaS universe was up only 3.6% year-to-date, well behind the S&P 500, which was up 11.8%. Gains in the quarter broadened, but the median SaaS company was still down 10.6% year-to-date.
SaaS stock performance before and after June 30, 2026*
Source: First Analysis, Capital IQ.
Notes: *For the period March 31, 2026, through Sept. 30, 2026.
The strongest group in the quarter was go-to-market technology, which gained 40.4%, reversing some of the losses early in the year, but the group was still down 8.9% year-to-date. The future of work group gained 38.3% on average but was still down 3.5% year-to-date. Cybersecurity stocks continued strong, up 39.1% for the quarter and 53.6% year-to-date.
The Internet of Things group was the laggard, losing 5.9% on average this quarter. Two of the five stocks in the group (Cerence and Powerfleet) dropped significantly due to missed quarterly estimates and disappointing guidance.
The largest gainer was Atlassian (TEAM), which added 130.5% after reporting strong earnings and raising guidance. Its AI offering also showed accelerating growth. However, the stock is only up 10.6% year-to-date. RingCentral (RNG) gained 91.6% as exploding numbers of AI agents are expected to need messaging infrastructure. The stock was up 158.7% year-to-date from a depressed level. Twenty companies declined in the quarter, with Teladoc (TDOC) dropping 31.6% due to poor earnings results and guidance, a similar story to the two IoT companies mentioned above.
Thirty-one companies traded below 3 times 2026 estimated revenue at the end of the quarter, down from 42 last quarter. For 2027 estimated revenue, 33 companies traded below 3 times, down from 58 last quarter. Some of the lower-multiple companies are getting attention in this concentrated market, but not all.
SaaS stock quarterly performance
| Company | 6/30/25 price |
9/30/25 price |
12/31/25 price |
3/31/26 price |
6/30/26 price |
9/30/26 price |
Prior QTR change |
Current QTR change |
|---|---|---|---|---|---|---|---|---|
| Data visibility | ||||||||
| AvePoint Inc. (AVPT) | $19.31 | $15.01 | $13.89 | $9.51 | $11.21 | $14.08 | 17.9% | 25.6% |
| C3 AI (AI) | $24.57 | $17.34 | $13.48 | $8.42 | $9.09 | $10.99 | 8.0% | 20.9% |
| Datadog Inc. (DDOG) | $134.33 | $142.40 | $135.99 | $118.05 | $260.36 | $273.85 | 120.6% | 5.2% |
| Elastic N.V. (ESTC) | $84.33 | $84.49 | $75.44 | $49.99 | $57.02 | $91.70 | 14.1% | 60.8% |
| MongoDB Inc. (MDB) | $209.99 | $310.38 | $419.69 | $244.77 | $335.90 | $348.61 | 37.2% | 3.8% |
| Snowflake Inc. (SNOW) | $223.77 | $225.55 | $219.36 | $150.82 | $254.50 | $339.56 | 68.7% | 33.4% |
| Average | 44.4% | 25.0% | ||||||
| Median | 27.6% | 23.3% | ||||||
| Cybersecurity | ||||||||
| Cloudflare Inc. (NET) | $195.83 | $214.59 | $197.15 | $206.34 | $245.28 | $347.28 | 18.9% | 41.6% |
| CrowdStrike Holdings (CRWD) | $127.33 | $122.60 | $117.19 | $97.60 | $190.79 | $264.75 | 95.5% | 38.8% |
| Netskope (NTSK) | $- | $22.73 | $17.54 | $8.49 | $10.94 | $17.44 | 28.9% | 59.4% |
| Okta Inc. (OKTA) | $99.97 | $91.70 | $86.47 | $78.71 | $136.45 | $209.11 | 73.4% | 53.3% |
| Qualys Inc. (QLYS) | $142.87 | $132.33 | $132.90 | $87.85 | $137.49 | $187.20 | 56.5% | 36.2% |
| Rubrik (RBRK) | $89.59 | $82.25 | $76.48 | $48.97 | $80.28 | $114.47 | 63.9% | 42.6% |
| SailPoint (SAIL) | $22.86 | $22.08 | $20.23 | $13.24 | $14.64 | $20.36 | 10.6% | 39.1% |
| SentinelOne Inc. (S) | $18.28 | $17.61 | $15.00 | $12.88 | $16.97 | $23.76 | 31.8% | 40.0% |
| Tenable Holdings Inc. (TENB) | $33.78 | $29.16 | $23.53 | $16.92 | $36.88 | $36.39 | 118.0% | (1.3%) |
| Zscaler Inc. (ZS) | $313.94 | $299.66 | $224.92 | $140.29 | $141.15 | $199.42 | 0.6% | 41.3% |
| Average | 49.8% | 39.1% | ||||||
| Median | 44.1% | 40.6% | ||||||
| E-commerce optimization | ||||||||
| Braze (BRZE) | $28.10 | $28.44 | $34.29 | $23.61 | $21.69 | $25.10 | (8.1%) | 15.7% |
| Commerce Inc. (CMRC) | $5.00 | $4.99 | $4.12 | $2.67 | $2.96 | $3.16 | 10.9% | 6.8% |
| Five9 Inc. (FIVN) | $26.48 | $24.20 | $20.05 | $15.17 | $21.32 | $34.01 | 40.5% | 59.5% |
| Klaviyo (KVYO) | $33.58 | $27.69 | $32.47 | $19.46 | $15.10 | $15.73 | (22.4%) | 4.2% |
| RingCentral Inc. (RNG) | $28.35 | $28.34 | $28.88 | $37.19 | $38.98 | $74.70 | 4.8% | 91.6% |
| Shopify Inc. (SHOP) | $115.35 | $148.61 | $160.97 | $118.62 | $114.18 | $148.30 | (3.7%) | 29.9% |
| Sprinklr Inc. (CXM) | $8.46 | $7.72 | $7.78 | $6.00 | $5.16 | $4.95 | (14.0%) | (4.1%) |
| SPS Commerce Inc. (SPSC) | $136.09 | $104.14 | $89.13 | $55.67 | $57.17 | $82.44 | 2.7% | 44.2% |
| Twilio Inc. (TWLO) | $124.36 | $100.09 | $142.24 | $125.82 | $206.33 | $292.46 | 64.0% | 41.7% |
| Weave Communications (WEAV) | $8.32 | $6.68 | $7.59 | $4.62 | $5.99 | $7.38 | 29.7% | 23.2% |
| Wix.com Ltd. (WIX) | $158.46 | $177.63 | $103.89 | $90.07 | $45.37 | $72.13 | (49.6%) | 59.0% |
| Yext Inc. (YEXT) | $8.50 | $8.52 | $8.06 | $3.84 | $4.67 | $6.47 | 21.6% | 38.5% |
| Average | 6.4% | 34.2% | ||||||
| Median | 3.8% | 34.2% | ||||||
| Enterprise productivity | ||||||||
| Asana Inc. (ASAN) | $13.50 | $13.36 | $13.71 | $6.40 | $7.00 | $8.43 | 9.4% | 20.4% |
| Atlassian Corp. Plc (TEAM) | $203.09 | $159.70 | $162.14 | $68.25 | $77.79 | $179.29 | 14.0% | 130.5% |
| Bentley Systems Inc. (BSY) | $53.97 | $51.48 | $38.17 | $35.12 | $29.89 | $31.95 | (14.9%) | 6.9% |
| Bill.com Holdings Inc. (BILL) | $46.26 | $52.97 | $54.54 | $38.30 | $36.16 | $42.54 | (5.6%) | 17.6% |
| BlackLine Inc. (BL) | $56.62 | $53.10 | $55.29 | $37.00 | $28.07 | $26.53 | (24.1%) | (5.5%) |
| Block Inc. (XYZ) | $67.93 | $72.27 | $65.09 | $60.18 | $76.00 | $73.53 | 26.3% | (3.3%) |
| Box Inc. (BOX) | $34.17 | $32.27 | $29.91 | $23.64 | $26.54 | $33.48 | 12.3% | 26.1% |
| DigitalOcean (DOCN) | $28.56 | $34.16 | $48.12 | $85.78 | $157.03 | $133.39 | 83.1% | (15.1%) |
| DocuSign Inc. (DOCU) | $77.89 | $72.09 | $68.40 | $47.41 | $44.42 | $67.15 | (6.3%) | 51.2% |
| Dropbox Inc. (DBX) | $28.60 | $30.21 | $27.80 | $22.72 | $27.47 | $33.85 | 20.9% | 23.2% |
| Dynatrace Inc. (DT) | $55.21 | $48.45 | $43.34 | $36.98 | $43.91 | $57.74 | 18.7% | 31.5% |
| Expensify Inc. (EXFY) | $2.59 | $1.85 | $1.51 | $0.87 | $1.79 | $2.25 | 105.8% | 25.7% |
| Figma (FIG) | $- | $51.87 | $37.37 | $21.14 | $18.09 | $21.02 | (14.4%) | 16.2% |
| GitLab Inc. (GTLB) | $45.11 | $45.08 | $37.53 | $21.64 | $30.53 | $47.25 | 41.1% | 54.8% |
| JFrog Ltd. (FROG) | $43.88 | $47.33 | $62.46 | $46.93 | $90.88 | $97.04 | 93.7% | 6.8% |
| Marqeta Inc. (MQ) | $23.32 | $21.12 | $19.00 | $16.32 | $16.24 | $17.00 | (0.5%) | 4.6% |
| monday.com Ltd. (MNDY) | $314.48 | $193.69 | $147.56 | $69.11 | $72.39 | $78.46 | 4.7% | 8.4% |
| Navan (NAVN) | $- | $- | $17.08 | $13.24 | $22.87 | $20.99 | 72.7% | (8.2%) |
| Paymentus Inc. (PAY) | $32.75 | $30.60 | $31.59 | $25.40 | $24.16 | $30.64 | (4.9%) | 26.8% |
| Pegasystems Inc. (PEGA) | $54.13 | $57.50 | $59.72 | $42.56 | $29.97 | $33.28 | (29.6%) | 11.0% |
| Workiva Inc. (WK) | $68.45 | $86.08 | $86.25 | $59.63 | $48.51 | $66.57 | (18.6%) | 37.2% |
| Average | 18.3% | 22.2% | ||||||
| Median | 9.4% | 17.6% | ||||||
| Future of work | ||||||||
| Coursera Inc. (COUR) | $8.76 | $11.71 | $7.36 | $5.82 | $5.64 | $4.96 | (3.1%) | (12.1%) |
| Paycom Software Inc. (PAYC) | $231.40 | $208.14 | $159.36 | $121.54 | $125.68 | $217.65 | 3.4% | 73.2% |
| Paylocity Holding Corp. (PCTY) | $181.19 | $159.27 | $152.50 | $108.04 | $104.53 | $142.57 | (3.2%) | 36.4% |
| Workday Inc. (WDAY) | $240.00 | $240.73 | $214.78 | $129.92 | $122.42 | $190.46 | (5.8%) | 55.6% |
| Average | (2.2%) | 38.3% | ||||||
| Median | (3.2%) | 46.0% | ||||||
| Go-to-market technology | ||||||||
| Amplitude Inc. (AMPL) | $12.40 | $10.72 | $11.58 | $6.82 | $7.65 | $13.85 | 12.2% | 81.0% |
| Appian Corp. (APPN) | $29.86 | $30.57 | $35.42 | $24.11 | $22.90 | $35.27 | (5.0%) | 54.0% |
| Freshworks Inc. (FRSH) | $14.91 | $11.77 | $12.25 | $8.03 | $10.12 | $12.79 | 26.0% | 26.4% |
| HubSpot Inc. (HUBS) | $556.63 | $467.80 | $401.30 | $244.10 | $182.51 | $204.98 | (25.2%) | 12.3% |
| salesforce.com (CRM) | $272.69 | $237.00 | $264.91 | $186.67 | $156.66 | $229.57 | (16.1%) | 46.5% |
| ServiceNow Inc. (NOW) | $205.62 | $184.06 | $153.19 | $104.55 | $99.28 | $134.01 | (5.0%) | 35.0% |
| UiPath Inc. (PATH) | $12.80 | $13.38 | $16.39 | $11.10 | $10.87 | $12.84 | (2.1%) | 18.1% |
| Zeta Global Corp. (ZETA) | $15.49 | $19.87 | $20.35 | $15.92 | $19.68 | $31.57 | 23.6% | 60.4% |
| ZoomInfo Technologies Inc. (GTM) | $10.12 | $10.91 | $10.17 | $5.98 | $2.93 | $3.79 | (51.0%) | 29.4% |
| Average | (4.7%) | 40.4% | ||||||
| Median | (5.0%) | 35.0% | ||||||
| Healthcare | ||||||||
| Certara Inc. (CERT) | $11.70 | $12.22 | $8.81 | $5.70 | $6.55 | $9.20 | 14.9% | 40.5% |
| Doximity Inc. (DOCS) | $61.34 | $73.15 | $44.28 | $23.30 | $20.74 | $28.34 | (11.0%) | 36.6% |
| Research Solutions (RSSS) | $2.87 | $3.73 | $2.94 | $2.26 | $2.32 | $2.16 | 2.7% | (6.9%) |
| Teladoc Health Inc. (TDOC) | $8.71 | $7.73 | $7.00 | $5.45 | $8.48 | $5.80 | 55.6% | (31.6%) |
| Veeva Systems Inc. (VEEV) | $287.98 | $297.91 | $223.23 | $175.66 | $177.47 | $285.45 | 1.0% | 60.8% |
| Average | 12.6% | 19.9% | ||||||
| Median | 2.7% | 36.6% | ||||||
| Internet of Things | ||||||||
| Alarm.com Holdings (ALRM) | $56.57 | $53.08 | $51.02 | $43.19 | $46.72 | $54.47 | 8.2% | 16.6% |
| Cerence Inc. (CRNC) | $10.21 | $12.46 | $10.69 | $6.31 | $11.32 | $7.83 | 79.4% | (30.8%) |
| PowerFleet (AIOT) | $4.31 | $5.24 | $5.32 | $3.08 | $3.83 | $2.84 | 24.4% | (25.8%) |
| Samsara Inc. (IOT) | $39.78 | $37.25 | $35.45 | $31.69 | $32.43 | $38.13 | 2.3% | 17.6% |
| ServiceTitan (TTAN) | $107.18 | $100.83 | $106.50 | $63.46 | $70.71 | $65.79 | 11.4% | (7.0%) |
| Average | 25.1% | (5.9%) | ||||||
| Median | 11.4% | (7.0%) | ||||||
| Supply chain technology | ||||||||
| Descartes Systems (TSX:DSG) | $101.43 | $94.08 | $87.82 | $71.38 | $69.17 | $81.09 | (3.1%) | 17.2% |
| Kinaxis Inc. (KXS) | $148.49 | $128.98 | $126.23 | $100.58 | $107.22 | $125.74 | 6.6% | 17.3% |
| Manhattan Associates (MANH) | $197.47 | $204.98 | $173.31 | $133.12 | $139.25 | $198.70 | 4.6% | 42.7% |
| Oracle Corp. (ORCL) | $218.63 | $281.24 | $194.91 | $147.11 | $146.55 | $137.30 | (0.4%) | (6.3%) |
| ReposiTrak Inc. (TRAK) | $19.65 | $14.82 | $12.37 | $7.60 | $9.00 | $8.37 | 18.4% | (7.0%) |
| SAP SE (SAP) | $303.17 | $267.39 | $245.09 | $169.38 | $153.09 | $210.83 | (9.6%) | 37.7% |
| WiseTech Global (WTC) | $71.48 | $59.69 | $45.66 | $26.09 | $22.83 | $22.57 | (12.5%) | (1.1%) |
| Average | 0.6% | 14.4% | ||||||
| Median | (0.4%) | 17.2% | ||||||
| Other SaaS | ||||||||
| Fastly Inc. (FSLY) | $7.06 | $8.55 | $10.18 | $29.06 | $18.36 | $25.67 | (36.8%) | 39.8% |
| Roblox Corp. (RBLX) | $105.20 | $138.52 | $81.03 | $56.56 | $54.38 | $42.37 | (3.9%) | (22.1%) |
| Unity Software Inc. (U) | $24.20 | $40.04 | $44.17 | $21.94 | $28.58 | $40.93 | 30.3% | 43.2% |
| Average | (3.5%) | 20.3% | ||||||
| Median | (3.9%) | 39.8% | ||||||
| Vertical SaaS | ||||||||
| Alkami Technology Inc. (ALKT) | $30.14 | $24.84 | $23.07 | $15.67 | $18.12 | $13.69 | 15.6% | (24.4%) |
| AppFolio Inc. (APPF) | $230.28 | $275.66 | $232.65 | $157.82 | $160.35 | $200.52 | 1.6% | 25.1% |
| CarGurus Inc. (CARG) | $33.47 | $37.23 | $38.35 | $34.05 | $34.09 | $31.16 | 0.1% | (8.6%) |
| Cellebrite DI (CLBT) | $16.00 | $18.53 | $18.03 | $13.78 | $14.60 | $11.26 | 6.0% | (22.9%) |
| CS Disco Inc. (LAW) | $4.37 | $6.46 | $7.76 | $3.82 | $3.78 | $4.10 | (1.0%) | 8.5% |
| EverCommerce Inc. (EVCM) | $10.50 | $11.13 | $12.11 | $11.43 | $10.06 | $8.66 | (12.0%) | (13.9%) |
| Intapp Inc. (INTA) | $51.62 | $40.90 | $45.82 | $25.69 | $25.21 | $36.21 | (1.9%) | 43.6% |
| LegalZoom.com Inc. (LZ) | $8.91 | $10.38 | $9.93 | $5.67 | $6.13 | $5.61 | 8.1% | (8.5%) |
| nCino Inc. (NCNO) | $27.97 | $27.11 | $25.64 | $14.98 | $16.35 | $18.13 | 9.1% | 10.9% |
| Procore Technologies Inc. (PCOR) | $68.42 | $72.92 | $72.74 | $57.00 | $40.62 | $51.72 | (28.7%) | 27.3% |
| Q2 Inc. (QTWO) | $93.59 | $72.39 | $72.16 | $47.30 | $48.10 | $55.44 | 1.7% | 15.3% |
| Average | (0.1%) | 4.8% | ||||||
| Median | 1.6% | 8.5% | ||||||
| Overall SaaS group | ||||||||
| Average | 14.6% | 23.8% | ||||||
| Median | 6.0% | 25.1% | ||||||
| S&P 500 (SPX) | 6,204.95 | 6,688.46 | 6,845.50 | 6,528.52 | 7,499.36 | 7,651.54 | 14.87% | 2.03% |
Source: Capital IQ, First Analysis.
SaaS public comparables ($ in millions)
| Company ($ in millions) |
LTM revenue |
Rev growth ’25A–’26E |
Rev growth ’26E–’27E |
LTM gross margin |
LTM EBITDA margin |
EV/rev ’26E |
EV/rev ’27E |
EV/EBITDA¹ ’26E |
EV/EBITDA¹ ’27E |
|---|---|---|---|---|---|---|---|---|---|
| Data visibility | |||||||||
| AvePoint Inc. (AVPT) | $466.2 | 21.7% | 20.5% | 73.4% | 11.3% | 5.07x | 4.21x | 27.6x | 20.1x |
| C3 AI (AI) | $232.4 | (30.4%) | 12.3% | 29.1% | (192.4%) | 5.49x | 4.89x | NMF | NMF |
| Datadog Inc. (DDOG) | $3,966.7 | 30.5% | 22.5% | 79.5% | 2.1% | 21.16x | 17.27x | NMF | NMF |
| Elastic N.V. (ESTC) | $1,802.2 | 15.3% | 14.4% | 75.6% | (1.2%) | 4.53x | 3.96x | 24.4x | 18.7x |
| MongoDB Inc. (MDB) | $2,782.8 | 22.8% | 18.7% | 72.7% | 0.5% | 8.50x | 7.16x | NMF | 31.3x |
| Snowflake Inc. (SNOW) | $5,434.6 | 34.9% | 28.2% | 67.0% | (19.1%) | 18.69x | 14.58x | NMF | NMF |
| Cybersecurity | |||||||||
| Cloudflare Inc. (NET) | $2,512.4 | 32.5% | 28.7% | 72.6% | (0.1%) | 42.84x | 33.29x | NMF | NMF |
| CrowdStrike Holdings (CRWD) | $5,396.1 | 24.8% | 22.6% | 75.2% | 2.0% | 44.54x | 36.33x | NMF | NMF |
| Netskope (NTSK) | $802.6 | 25.6% | 21.1% | 69.9% | (89.8%) | 7.63x | 6.29x | NMF | NMF |
| Okta Inc. (OKTA) | $3,073.0 | 10.4% | 10.0% | 78.1% | 10.4% | 10.64x | 9.67x | NMF | 34.8x |
| Qualys Inc. (QLYS) | $703.0 | 9.9% | 8.2% | 83.4% | 36.2% | 7.93x | 7.32x | 17.4x | 16.1x |
| Rubrik (RBRK) | $1,542.2 | 28.5% | 21.5% | 80.2% | (17.1%) | 13.68x | 11.26x | NMF | NMF |
| SailPoint (SAIL) | $1,165.5 | 18.6% | 18.8% | 66.3% | (0.8%) | 8.93x | 7.52x | NMF | NMF |
| SentinelOne Inc. (S) | $1,098.7 | 20.3% | 17.9% | 72.5% | (21.6%) | 6.32x | 5.36x | NMF | 32.9x |
| Tenable Holdings Inc. (TENB) | $1,043.5 | 7.9% | 7.1% | 78.1% | 5.1% | 3.83x | 3.57x | 14.8x | 13.4x |
| Zscaler Inc. (ZS) | $3,352.5 | 21.4% | 16.2% | 76.9% | 1.3% | 8.48x | 7.30x | 30.3x | 25.3x |
| E-commerce optimization | |||||||||
| Braze (BRZE) | $834.2 | 23.6% | 17.0% | 66.3% | (10.3%) | 2.78x | 2.38x | 26.6x | 18.2x |
| Commerce Inc. (CMRC) | $346.9 | (0.8%) | 0.2% | 77.2% | 6.1% | 0.80x | 0.79x | 8.8x | 4.2x |
| Five9 Inc. (FIVN) | $1,203.9 | 10.3% | 9.8% | 55.1% | 12.6% | 2.15x | 1.96x | 8.7x | 7.5x |
| Klaviyo (KVYO) | $1,389.7 | 24.1% | 19.6% | 73.8% | (0.8%) | 2.46x | 2.05x | 15.5x | 12.3x |
| RingCentral Inc. (RNG) | $2,583.9 | 5.0% | 4.5% | 71.9% | 16.0% | 2.84x | 2.71x | 10.3x | 9.8x |
| Shopify Inc. (SHOP) | $13,269.0 | 31.9% | 25.8% | 47.8% | 18.0% | 12.17x | 9.67x | NMF | NMF |
| Sprinklr Inc. (CXM) | $872.9 | 1.2% | 3.5% | 65.6% | 5.9% | 0.85x | 0.82x | 4.6x | 4.1x |
| SPS Commerce Inc. (SPSC) | $772.5 | 5.2% | 6.3% | 69.8% | 23.7% | 3.54x | 3.33x | 10.5x | 9.5x |
| Twilio Inc. (TWLO) | $5,572.3 | 18.4% | 11.5% | 48.6% | 9.0% | 7.22x | 6.48x | 34.7x | 29.3x |
| Weave Communications (WEAV) | $257.8 | 14.7% | 13.4% | 72.4% | (3.7%) | 2.05x | 1.81x | 30.2x | 21.2x |
| Wix.com Ltd. (WIX) | $2,133.7 | 13.3% | 10.8% | 66.6% | (6.9%) | 1.81x | 1.64x | 14.7x | 9.7x |
| Yext Inc. (YEXT) | $443.0 | (0.8%) | 1.0% | 74.9% | 9.0% | 1.75x | 1.73x | 5.8x | 5.4x |
| Enterprise productivity | |||||||||
| Asana Inc. (ASAN) | $828.1 | 9.0% | 7.9% | 87.6% | (13.2%) | 2.15x | 1.99x | 17.0x | 14.1x |
| Atlassian Corp. Plc (TEAM) | $6,572.3 | 23.0% | 12.5% | 85.6% | 6.6% | 6.41x | 5.69x | 20.3x | 21.6x |
| Bentley Systems Inc. (BSY) | $1,602.0 | 12.9% | 10.5% | 81.8% | 29.2% | 6.51x | 5.89x | 18.0x | 15.8x |
| Bill.com Holdings Inc. (BILL) | $1,653.2 | 11.8% | 11.0% | 83.9% | 6.1% | 2.07x | 1.86x | 8.0x | 6.9x |
| BlackLine Inc. (BL) | $732.4 | 9.5% | 10.4% | 75.6% | 8.8% | 2.26x | 2.04x | 7.6x | 6.7x |
| Block Inc. (XYZ) | $25,042.0 | 7.8% | 11.3% | 46.6% | 6.2% | 1.72x | 1.54x | 9.6x | 7.8x |
| Box Inc. (BOX) | $1,234.1 | 9.6% | 8.7% | 79.5% | 10.7% | 4.03x | 3.71x | 13.0x | 11.5x |
| DigitalOcean (DOCN) | $1,011.1 | 30.8% | 53.7% | 57.2% | 30.5% | 14.33x | 9.32x | NMF | 23.2x |
| DocuSign Inc. (DOCU) | $3,361.2 | 8.9% | 8.0% | 79.6% | 13.1% | 3.41x | 3.16x | 9.6x | 9.0x |
| Dropbox Inc. (DBX) | $2,531.6 | (0.1%) | (0.3%) | 79.7% | 32.8% | 4.06x | 4.07x | 8.8x | 8.8x |
| Dynatrace Inc. (DT) | $2,095.6 | 16.1% | 14.6% | 81.6% | 13.9% | 7.00x | 6.11x | 23.7x | 19.5x |
| Expensify Inc. (EXFY) | $138.1 | (4.4%) | 0.2% | 48.7% | (9.5%) | 1.07x | 1.06x | 5.8x | 5.7x |
| Figma (FIG) | $1,281.5 | 39.1% | 23.8% | 79.1% | (122.0%) | 6.54x | 5.28x | NMF | NMF |
| GitLab Inc. (GTLB) | $1,055.2 | 18.5% | 15.7% | 85.9% | (5.6%) | 5.88x | 5.08x | NMF | 33.1x |
| JFrog Ltd. (FROG) | $600.0 | 22.4% | 17.9% | 77.9% | (6.8%) | 17.14x | 14.53x | NMF | NMF |
| Marqeta Inc. (MQ) | $677.2 | 12.7% | 14.7% | 70.0% | 2.5% | 1.53x | 1.33x | 7.4x | 6.0x |
| monday.com Ltd. (MNDY) | $1,366.6 | 19.4% | 15.1% | 88.7% | 3.7% | 1.69x | 1.47x | 10.0x | 8.1x |
| Navan (NAVN) | $825.9 | 32.6% | 24.0% | 72.6% | (19.5%) | 5.17x | 4.17x | NMF | 28.8x |
| Paymentus Inc. (PAY) | $1,360.4 | 21.2% | 17.9% | 24.9% | 8.0% | 2.41x | 2.04x | 19.1x | 16.1x |
| Pegasystems Inc. (PEGA) | $1,748.4 | 7.0% | 8.6% | 75.9% | 13.0% | 2.77x | 2.56x | 10.2x | 9.0x |
| Workiva Inc. (WK) | $965.7 | 17.8% | 15.5% | 80.2% | 4.4% | 3.45x | 2.99x | 18.5x | 14.6x |
| Future of work | |||||||||
| Coursera Inc. (COUR) | $885.4 | 63.2% | 21.9% | 55.9% | (4.2%) | 0.27x | 0.22x | 2.0x | 1.4x |
| Paycom Software Inc. (PAYC) | $2,140.7 | 7.7% | 7.4% | 88.1% | 34.3% | 4.72x | 4.39x | 10.3x | 9.4x |
| Paylocity Holding Corp. (PCTY) | $1,771.3 | 9.4% | 6.5% | 69.3% | 24.2% | 4.04x | 3.80x | 11.0x | 10.3x |
| Workday Inc. (WDAY) | $10,155.0 | 11.7% | 10.5% | 75.8% | 15.6% | 4.34x | 3.93x | 12.9x | 11.2x |
| Go-to-market technology | |||||||||
| Amplitude Inc. (AMPL) | $374.4 | 19.5% | 15.9% | 72.4% | (25.7%) | 3.85x | 3.32x | NMF | NMF |
| Appian Corp. (APPN) | $795.3 | 16.9% | 10.8% | 72.4% | 5.0% | 3.12x | 2.82x | 24.6x | 19.6x |
| Freshworks Inc. (FRSH) | $903.9 | 15.0% | 14.2% | 85.0% | 6.4% | 2.81x | 2.46x | 10.8x | 9.2x |
| HubSpot Inc. (HUBS) | $3,449.0 | 17.7% | 14.1% | 83.2% | 4.5% | 2.48x | 2.17x | 9.9x | 8.1x |
| salesforce.com (CRM) | $43,938.0 | 11.5% | 9.7% | 77.3% | 29.4% | 4.75x | 4.33x | 11.7x | 10.8x |
| ServiceNow Inc. (NOW) | $14,732.0 | 22.1% | 18.8% | 74.8% | 19.7% | 8.65x | 7.28x | 23.2x | 19.2x |
| UiPath Inc. (PATH) | $1,720.9 | 11.3% | 8.4% | 82.6% | 10.7% | 2.99x | 2.76x | 11.3x | 10.3x |
| Zeta Global Corp. (ZETA) | $1,570.9 | 39.5% | 16.0% | 59.5% | 7.4% | 4.31x | 3.71x | 19.3x | 15.8x |
| ZoomInfo Technologies Inc. (GTM) | $1,257.7 | (3.0%) | (2.4%) | 86.5% | 26.9% | 2.04x | 2.09x | 5.0x | 5.0x |
| Healthcare | |||||||||
| Certara Inc. (CERT) | $421.7 | (9.4%) | 2.6% | 61.6% | 22.3% | 4.00x | 3.90x | 13.6x | 13.0x |
| Doximity Inc. (DOCS) | $655.6 | 4.7% | 6.0% | 88.1% | 31.8% | 6.55x | 6.18x | 13.6x | 12.7x |
| Research Solutions (RSSS) | $48.3 | (1.8%) | 3.8% | 51.9% | 10.0% | 1.20x | 1.15x | 9.6x | 8.4x |
| Teladoc Health Inc. (TDOC) | $2,489.5 | (4.3%) | (1.0%) | 69.0% | 2.6% | 0.54x | 0.55x | 4.7x | 4.6x |
| Veeva Systems Inc. (VEEV) | $3,458.1 | 15.5% | 12.3% | 75.0% | 31.1% | 10.60x | 9.44x | 23.4x | 20.8x |
| Internet of Things | |||||||||
| Alarm.com Holdings (ALRM) | $1,061.0 | 7.1% | 4.7% | 65.8% | 15.8% | 2.59x | 2.47x | 12.6x | 11.7x |
| Cerence Inc. (CRNC) | $309.5 | (15.4%) | 10.3% | 78.7% | 14.1% | 1.55x | 1.40x | 11.2x | 5.7x |
| PowerFleet (AIOT) | $450.4 | 6.2% | 10.9% | 55.7% | 19.1% | 1.40x | 1.26x | 6.3x | 4.8x |
| Samsara Inc. (IOT) | $1,847.6 | 26.4% | 20.0% | 76.4% | 1.7% | 10.30x | 8.58x | NMF | NMF |
| ServiceTitan (TTAN) | $1,064.7 | 18.9% | 14.5% | 71.2% | (7.0%) | 5.18x | 4.52x | 28.4x | 22.4x |
| Supply chain technology | |||||||||
| Descartes Systems (TSX:DSG) | $775.2 | 13.9% | 12.9% | 77.6% | 42.7% | 7.89x | 6.99x | 17.1x | 15.0x |
| Kinaxis Inc. (KXS) | $603.2 | 16.6% | 12.6% | 66.1% | 18.7% | 4.93x | 4.38x | 18.8x | 16.4x |
| Manhattan Associates (MANH) | $1,126.2 | 7.7% | 8.6% | 55.8% | 25.7% | 9.83x | 9.05x | 27.6x | 24.9x |
| Oracle Corp. (ORCL) | $71,776.0 | 26.3% | 40.6% | 64.0% | 48.0% | 7.19x | 5.11x | 12.5x | 9.3x |
| ReposiTrak Inc. (TRAK) | $23.3 | (8.7%) | 24.8% | 85.8% | 35.6% | 5.84x | 4.68x | 15.1x | 11.8x |
| SAP SE (SAP) | $44,727.5 | 5.8% | 11.8% | 73.3% | 30.3% | 5.29x | 4.74x | 16.7x | 14.5x |
| WiseTech Global (WTC) | $1,395.9 | 34.1% | 9.5% | 77.4% | 40.5% | 6.57x | 6.00x | 14.6x | 11.9x |
| Other SaaS | |||||||||
| Fastly Inc. (FSLY) | $687.2 | 18.7% | 14.3% | 61.5% | (5.6%) | 5.60x | 4.90x | 30.3x | 23.4x |
| Roblox Corp. (RBLX) | $5,685.6 | 41.1% | 12.4% | 25.7% | (14.8%) | 4.21x | 3.75x | 24.0x | 19.8x |
| Unity Software Inc. (U) | $2,028.4 | 20.1% | 20.7% | 76.1% | 7.2% | 8.22x | 6.81x | 26.4x | 19.1x |
| Vertical SaaS | |||||||||
| Alkami Technology Inc. (ALKT) | $489.7 | 19.4% | 16.6% | 57.4% | (4.5%) | 3.27x | 2.81x | 17.8x | 13.0x |
| AppFolio Inc. (APPF) | $1,040.9 | 18.2% | 17.4% | 63.5% | 18.7% | 6.15x | 5.24x | 21.6x | 17.4x |
| CarGurus Inc. (CARG) | $967.3 | 11.8% | 8.9% | 92.4% | 28.2% | 2.80x | 2.57x | 8.2x | 7.4x |
| Cellebrite DI (CLBT) | $514.3 | 17.0% | 15.1% | 83.0% | 15.2% | 4.13x | 3.59x | 14.8x | 12.5x |
| CS Disco Inc. (LAW) | $167.1 | 12.0% | 10.5% | 74.8% | (20.8%) | 0.97x | 0.88x | NMF | NMF |
| EverCommerce Inc. (EVCM) | $598.1 | 4.2% | 4.9% | 77.8% | 20.6% | 3.15x | 3.00x | 10.4x | 9.8x |
| Intapp Inc. (INTA) | $577.8 | 13.9% | 13.5% | 75.8% | (2.8%) | 4.25x | 3.74x | 18.7x | 15.9x |
| LegalZoom.com Inc. (LZ) | $792.5 | 5.8% | 4.5% | 66.7% | 5.6% | 1.01x | 0.97x | 4.2x | 3.9x |
| nCino Inc. (NCNO) | $622.2 | 8.6% | 8.5% | 62.2% | 14.8% | 3.39x | 3.12x | 12.3x | 10.3x |
| Procore Technologies Inc. (PCOR) | $1,422.4 | 14.5% | 13.3% | 80.1% | 4.6% | 4.80x | 4.24x | 18.8x | 13.6x |
| Q2 Inc. (QTWO) | $846.2 | 11.4% | 10.2% | 57.0% | 13.5% | 3.83x | 3.48x | 13.7x | 11.8x |
| Overall SaaS Group | |||||||||
| Average | $3,807.6 | 14.7% | 13.3% | 71.1% | 4.7% | 5.98x | 5.10x | 15.2x | 14.0x |
| Median | $1,126.2 | 14.5% | 12.4% | 74.8% | 7.2% | 4.21x | 3.80x | 13.6x | 12.3x |
Source: Capital IQ, First Analysis.
Notes: Public comparable company data shown above is as of Sept. 30, 2026. (1) EBITDA multiples less than 0 and greater than 35 labeled “not meaningful” (NMF). LTM = last 12 months. EBITDA = earnings before interest, taxes, depreciation and amortization.
SaaS M&A: Notable transactions include ArisGlobal and Accelerant
We highlight two noteworthy merger and acquisition announcements in the SaaS sector in the September quarter.
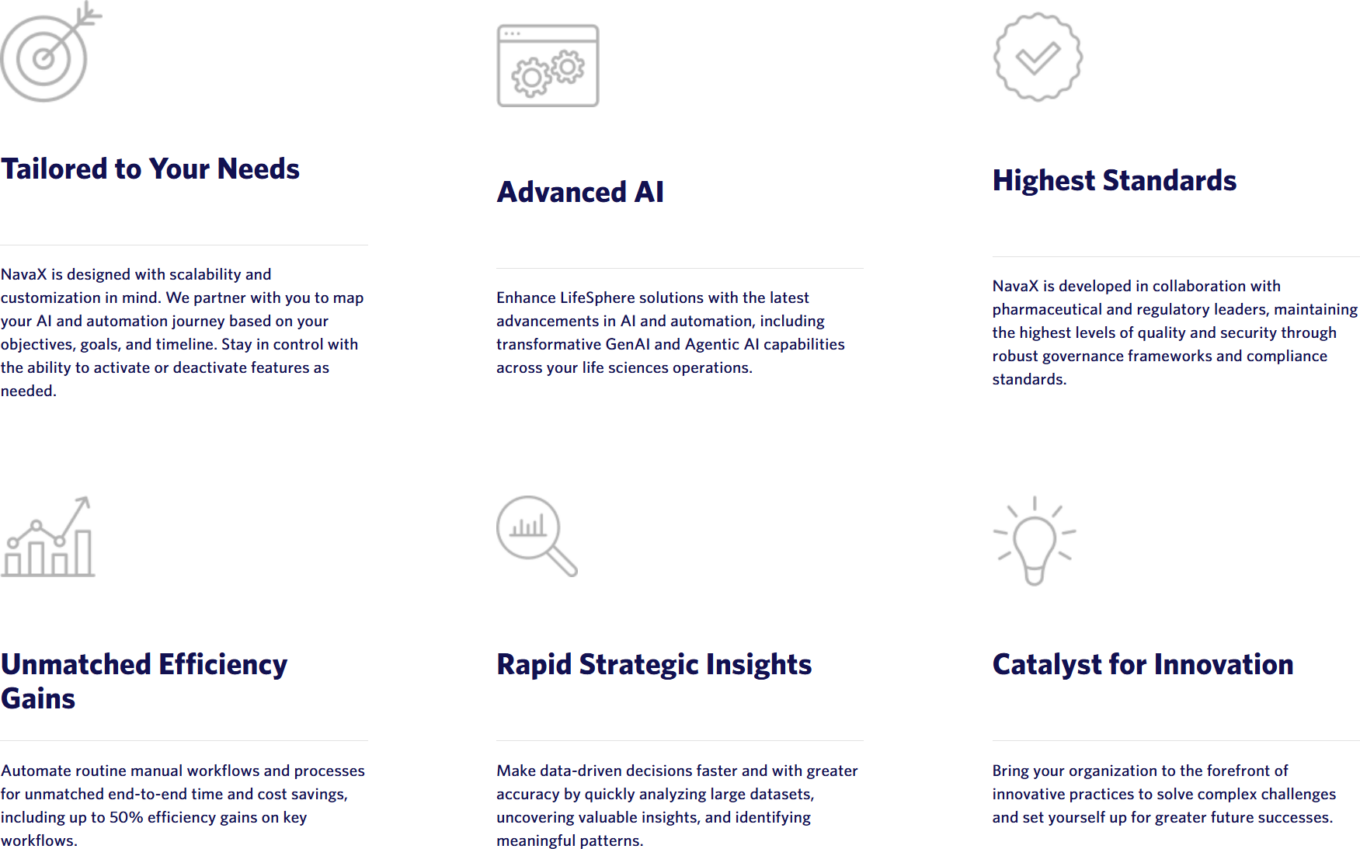
In late July, Dassault Systèmes agreed to acquire ArisGlobal, an AI-native enterprise compliance platform for life science companies, for approximately $1.8 billion in cash at closing, plus up to $200 million in additional consideration tied to multi-year AI revenue milestones. The total is 11.4 times estimated 2026 revenue. ArisGlobal serves more than 200 customers, including half of the top 50 global biopharma companies, as well as biotech, medtech, contract research organizations and health authorities. It processes over 12 million patient safety cases each year across pharmacovigilance, medical affairs, regulatory submissions and quality workflows. Its NavaX platform runs clinical-grade AI at production scale within regulated environments, delivering more than 30% productivity gains. The acquisition pairs Dassault Systèmes’ modeling, simulation and virtual-twin expertise across discovery, clinical development and manufacturing with ArisGlobal’s leadership in regulated operations and real-world evidence. Dassault expects the transaction to be accretive to revenue growth and EPS in its first year and to close in the second half of 2026.
Key benefits of NavaX
Source: ArisGlobal.
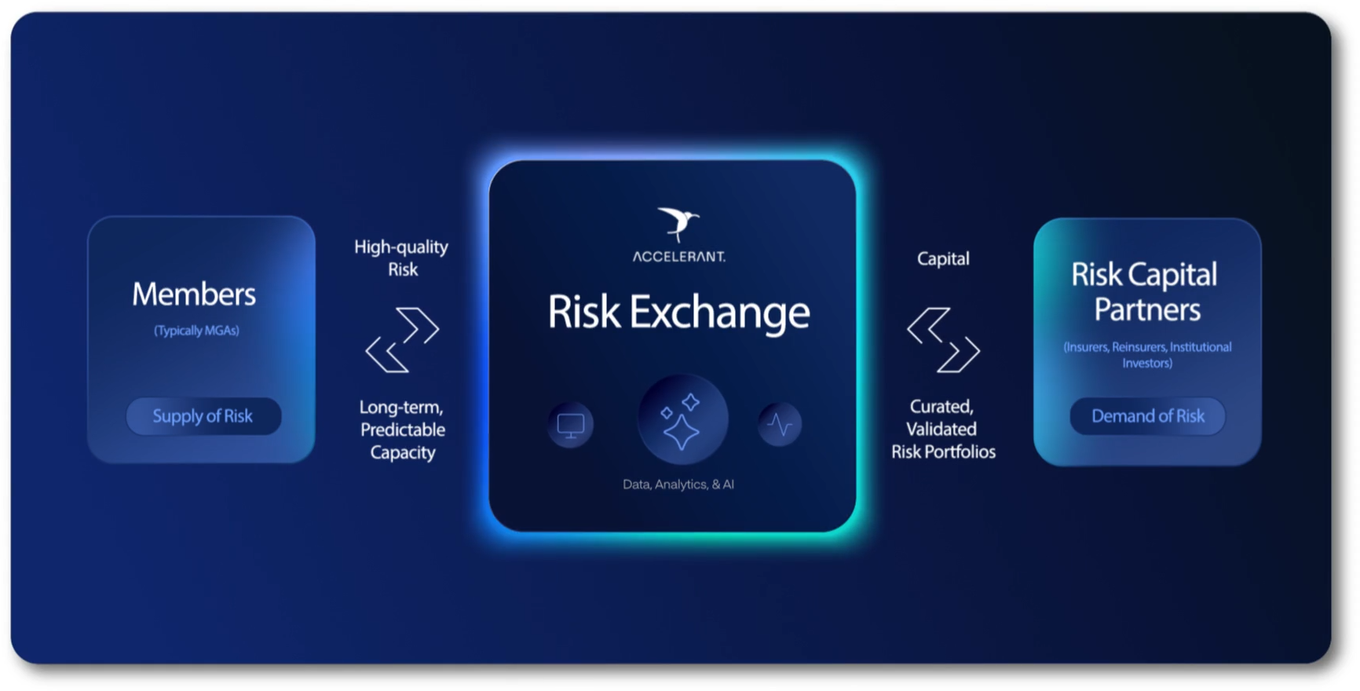
In August, Thoma Bravo announced it would acquire Accelerant (ARX) in a take-private transaction valued at more than $4 billion. Accelerant shareholders will receive $20.25 per share in cash, a 49% premium to the stock’s closing price the day prior to the announcement. Accelerant operates the Accelerant Risk Exchange, a data-driven platform that connects specialty insurance underwriters, typically managing general agents, with risk capital partners including insurers, reinsurers and institutional investors, using real-time data and analytics to source, underwrite and monitor risk. The transaction is expected to close in the first half of 2027.
The Accelerant Risk Exchange connects members with risk capital partners
Source: Accelerant.
Select recent M&A transactions (sorted by date of announcement, $ in millions)
| Date | Target | Target business description |
Buyer | Enterprise value (EV) | EV/ revenue |
|---|---|---|---|---|---|
| 9/10/2026 | Miro | Workplace collaboration platform | Bending Spoons (BSP) | $1,360.0 | 2.3x |
| 9/1/2026 | Extensiv | Warehouse management and fulfillment software | Descartes Systems Group (DSGX) | $120.0 | Undisclosed |
| 8/18/2026 | Weave Communications (WEAV) | Patient engagement and payments platform | Francisco Partners | $650.0 | 2.1x |
| 8/13/2026 | Accelerant | Operates the Accelerant Risk Exchange, a data-driven platform that connects specialty insurance underwriters with risk capital partners including insurers, reinsurers and institutional investors | Thoma Bravo | $4,000.0 | 3.5x |
| 8/4/2026 | Airtable | Relational database and app-building platform | Bending Spoons (BSP) | $1,290.0 | 2.7x |
| 7/28/2026 | Oasis Security | Non-human identity and access management platform | Cyera | $1,000.0 | Undisclosed |
| 7/23/2026 | ArisGlobal | Enterprise compliance platform for life science companies processing patient safety cases across pharmacovigilance, medical affairs, regulatory submissions and quality workflows | Dassault Systèmes | $2,000.0 | 11.4x |
| 7/22/2026 | Domo (assets) | Cloud business intelligence and data analytics platform | Progress Software (PRGS) | $400.0 | 0.8x |
Source: Capital IQ, First Analysis.
SaaS private placements: Notable transactions include Chai Discovery and Factory
We highlight two noteworthy private placement announcements in the SaaS sector in the September quarter.
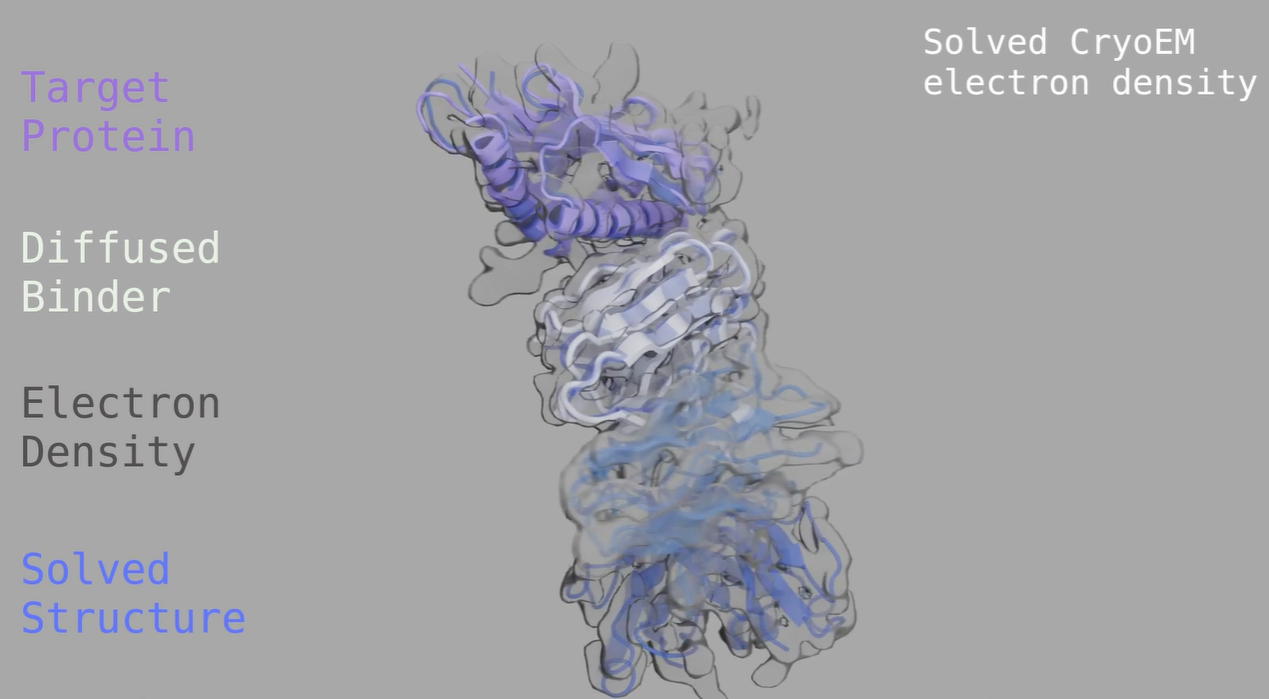
In July, Chai Discovery announced a $400 million Series C investment led by Index Ventures, with participation from Kleiner Perkins, Sequoia Capital, Dimension and a group of other new and existing investors. The transaction valued the company at $3.8 billion. Chai Discovery builds AI models that predict and reprogram the interactions between molecules to accelerate pre-clinical drug discovery, helping pharmaceutical companies pursue targets that traditional discovery methods have struggled to reach. Its latest model, Chai-3, improves target success rates and binding affinity over its predecessor, which was the first zero-shot generative platform for fully de novo antibody design to achieve double-digit experimental success rates. The new capital will support continued development of Chai’s models and their deployment across pharmaceutical research and development partnerships as the company scales AI-driven molecular design.
Chai Discovery: Antibody binding applications
Source: Chai Discovery.
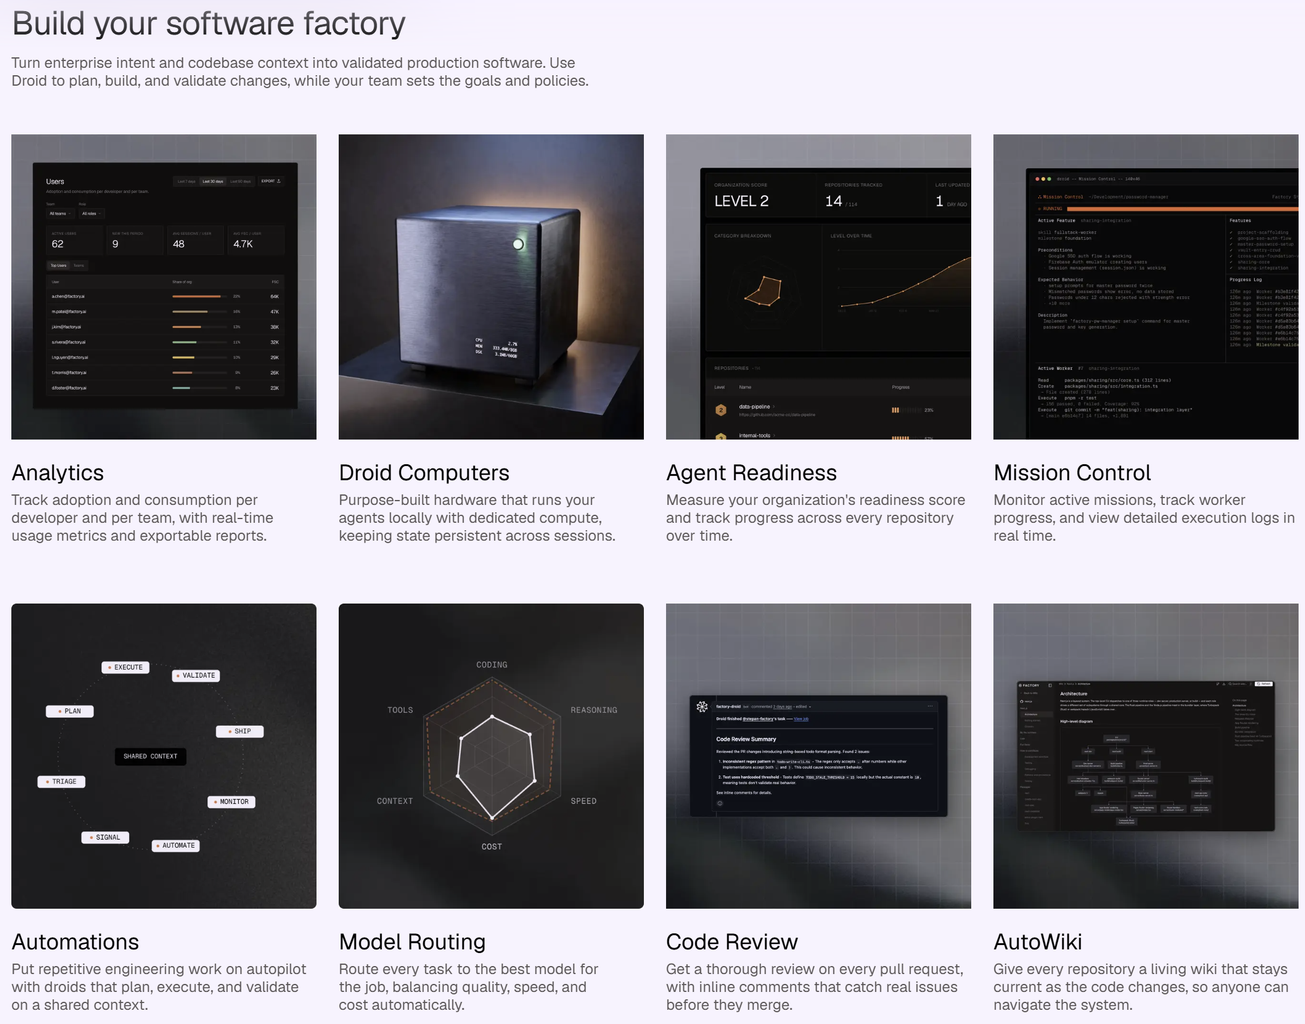
In September, Factory announced it had raised $200 million at a $5 billion valuation from Blackstone, Khosla Ventures, Sequoia Capital, Insight Partners, Evantic Capital, Sound Ventures, NEA, Mantis VC and Clearlake, bringing its total funding to more than $400 million. Factory develops AI coding agents, called Droids, that bring autonomy to software engineering. It provides enterprises a single, trusted system across the entire software development life cycle with control over which models it uses and where it runs, whether in the cloud, on-premises or in fully air-gapped environments. Factory is used by developers at companies including Nvidia, Blackstone, Royal Bank of Canada, Palo Alto Networks, Adobe and T-Mobile.
Factory’s Droid platform plans, builds and validates software across the development life cycle
Source: Factory
Select recent private placements (sorted by date of announcement, $ in millions)
| Date | Company | Business description |
Investors | Raise type | Amount raised |
Total amount raised |
|---|---|---|---|---|---|---|
| 9/30/2026 | Onomondo | IoT infrastructure and connectivity | Aspirity Partners | Growth | $113.6 | $139.3 |
| 9/29/2026 | Ortet | Frontier health AI lab | Thoreau Partners | Venture | $500.0 | $500.0 |
| 9/23/2026 | Hubble Network | Space-based Bluetooth connectivity network | Carthona Capital; Earthshot Ventures; RPM Ventures; Seraphim Space; Smith Point Capital; Y Combinator | Series C | $200.0 | $300.8 |
| 9/18/2026 | Angle Health | Health benefits platform | Blumberg Capital; Portage Venture Partners; PruVen Capital; Town Hall Ventures; Vitruvian Partners; Y Combinator | Series C | $200.0 | $396.0 |
| 9/15/2026 | Factory | Provides AI coding agents for autonomous software engineering | Insight Partners; Menlo Ventures; New Enterprise Associates; Sequoia Capital; Blackstone; Khosla Ventures; Clearlake Capital Group; Sound Ventures; Mantis Capital; Evantic Capital | Venture | $200.0 | $421.5 |
| 9/10/2026 | Harvey | Legal AI platform | Diffusion; Lightspeed; Sequoia Capital; Kleiner Perkins; a16z; Coatue; Conviction; Elad Gill; Goldman Sachs; GIC; Evantic; Sapphire Ventures; Whale Rock | Growth | $550.3 | $1,928.0 |
| 9/10/2026 | Motive | Physical operations and fleet management platform | General Catalyst | Growth | $1,300.0 | $2,176.2 |
| 9/8/2026 | Cylake | Cybersecurity products that operate entirely on premises or in private cloud environments, enabling organizations to maintain full control over their data, infrastructure, and operations | Lightspeed; Picture Capital; Redpoint Ventures | Growth | $245.0 | $290.0 |
| 8/12/2026 | Databricks | Data and AI platform | Coatue; Blackstone; MGX; T. Rowe Price; Sixth Street Growth; BOND; Clearlake Capital; Point72; Premji Invest; TPG; a16z; Dragoneer; Fidelity; Franklin Templeton; GIC; Goldman Sachs; Insight Partners; JPMorgan Private Capital; Kinetic; Morgan Stanley; NEA; Ontario Teachers’ Pension Plan; Temasek; Thrive Capital; WCM | Series M | $5,000.0 | $31,981.9 |
| 7/28/2026 | Spur Intelligence | Cybersecurity software for detecting and identifying fraudulent and abusive internet traffic | Insight Partners | Growth | $200.0 | $200.0 |
| 7/28/2026 | LearnVector | AI-native learning company | Coursera (COUR) | Growth | $100.0 | $100.0 |
| 7/22/2026 | Glow Security | AI-powered endpoint security software for enterprise and government organizations | Cyberstarts; Greenoaks; Holly Ventures; Index Ventures; Lux Capital; Operator Collective; Redpoint; Sequoia; Swish Ventures | Series B | $100.0 | $180.0 |
| 7/14/2026 | Chai Discovery | AI models that predict and reprogram the interactions between molecules to accelerate pre-clinical drug discovery | Avenir; Avra; Baillie Gifford & Co.; Bain Capital Ventures; Battery Ventures; BDT & MSD Partners; Dimension; General Catalyst; Glade Brook Capital Partners; Index Ventures; Kleiner Perkins Caufield & Byers; Lachy Groom; Menlo Ventures; Oak HC/FT; OpenAI; Sapphire Ventures; Sequoia; Thrive Capital; Yosemite | Series C | $400.0 | $630.3 |
Source: Capital IQ, First Analysis.

Request full report
To access the full report, please provide your contact information in the form below. Thank you for your interest in First Analysis research.